Monitoring Linux Audit
This is part three in a series where we examine “gaps” in our distributed traces.
Previously, we wrote about encountering these gaps in our distributed traces, and using ftrace to trace these gaps to syscall delays induced by Linux Audit.
In this final part, we’ll talk about monitoring improvements we’ve made to mitigate syscall delays and other risks associated with Linux Audit.
What is Linux Audit? #
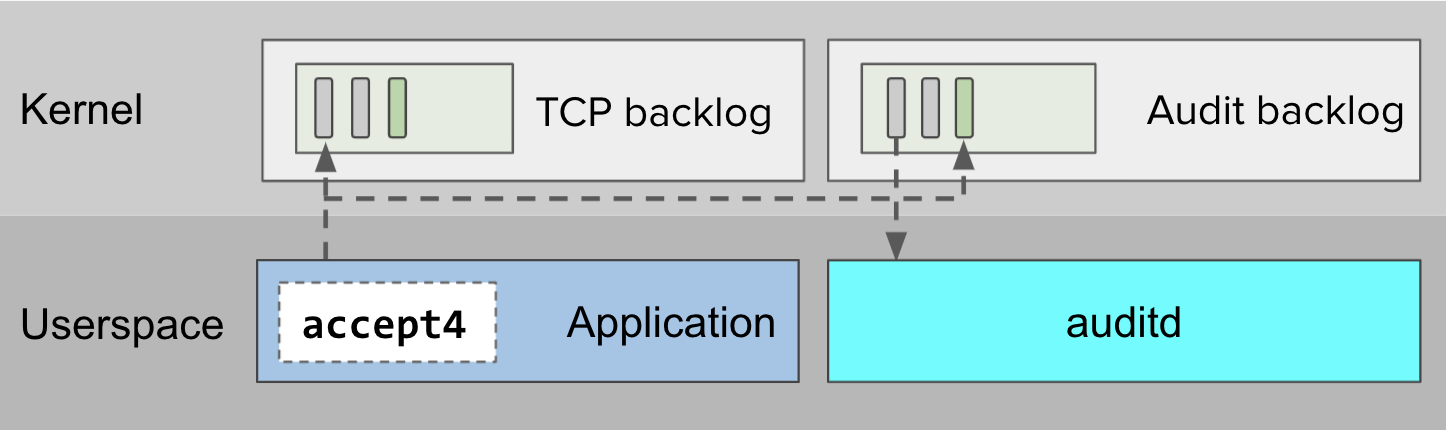
Linux Audit generates audit records in response to syscalls. These records may contain security-relevant information, for example about privilege escalation attempts or suspicious network activity. When syscalls happen — like the accept4 syscall in diagram 1 below — Linux enqueues audit records onto an internal backlog for asynchronous processing by userspace consumers like auditd.
auditd.Options, risks and signals #
On high throughput systems, Linux may produce audit records faster than userspace consumers can handle. Depending on how Linux audit is configured, this can lead to memory exhaustion, lost audit records, or syscall delays.
Options #
There are a number of Linux Audit configuration options, but the two we’ll look at are backlog_limit and backlog_wait_time. These options govern, respectively, the maximum size of the backlog, and how long Linux will wait for a full backlog to drain before dropping (a.k.a. “losing”) a record.
Risks #
These options can be adjusted to make risk tradeoffs. Disabling backlog_limit or setting it to a very high value reduces the risk of backlog overflows, but increases the risk of memory exhaustion. Decreasing backlog_wait_time can reduce the duration of delays induced by Linux audit waiting for the backlog to drain, but can also increase the risk of dropped audit records.
Signals #
Depending on the risk profile of your Linux Audit configuration, you may want to prioritize monitoring some signals over others. For example, if the backlog_limit is non-zero, keep an eye on backlog utilization to mitigate the risks associated with backlog overflow. On the other hand, if it is set to zero, then pay closer attention to system memory utilization.
Guidance #
Assume for a moment that there is a high throughput Linux machine where the userspace audit record consumer is periodically struggling to keep pace with the rate of record production.
The table below shows the severity of risks and the importance of signals relative to different Linux Audit configurations that could be set on that machine. Actual risk severity and signal importance depends on factors such as machine hardware and workload characteristics.
| Linux Audit configuration options | ||||
backlog_limit | 0 | 64 | 64 | |
backlog_wait_time | 0 | 0 | 60000 | |
| Relative risk severity | ||||
| Memory exhaustion (from audit records) | High | Low | Low | |
| Lost audit records | High | Medium | Low | |
| Syscall delays (induced by Linux Audit) | None | None | High | |
| Relative signal importance | ||||
| Memory utilization | High | Low | Low | |
| Backlog utilization | None | High | Medium | |
| Backlog waiting | None | None | High | |
Metrics and measurement tools #
At TpT, our backlog_limit is set to 5000, and our backlog_wait_time is set to 15000. We wrote previously about how these settings, combined with high throughput and insufficient memory allocation for our userspace audit record processor, led to backlog overflow and syscall delays. Given our configuration and risk profile, it makes sense for us to prioritize monitoring backlog utilization, backlog waiting, and lost audit records.
The most natural source of these signals is the status object. Along with Linux audit configuration option values, the kernel maintains internal counters for backlog size and lost records, which it exposes through the status object.
Collecting status metrics #
The status object can be retrieved with auditctl -s or via a Netlink socket.
$ sudo auditctl -s | grep backlog\|lost | sort
backlog 0
backlog_limit 5000
backlog_wait_time 15000
lost 0
We expose these metrics with linux-audit-exporter, a simple Prometheus exporter we created to make it easier to work with Linux Audit status. We use the bundled Helm chart to deploy it to all of our EKS nodes, and then use DataDog to collect the output. From there, we use DataDog to monitor backlog utilization (100 * (backlog / backlog_limit)) and dropped records (lost).
Backlog waiting #
This is a good start, but incomplete. It’s possible for the backlog to overflow, the kernel to induce delays in syscalls, and then for the backlog to drain while syscalls are delayed. If this happens between metric collection passes, then we won’t see spikes in backlog utilization, and will be left wondering why our application performance is degraded.
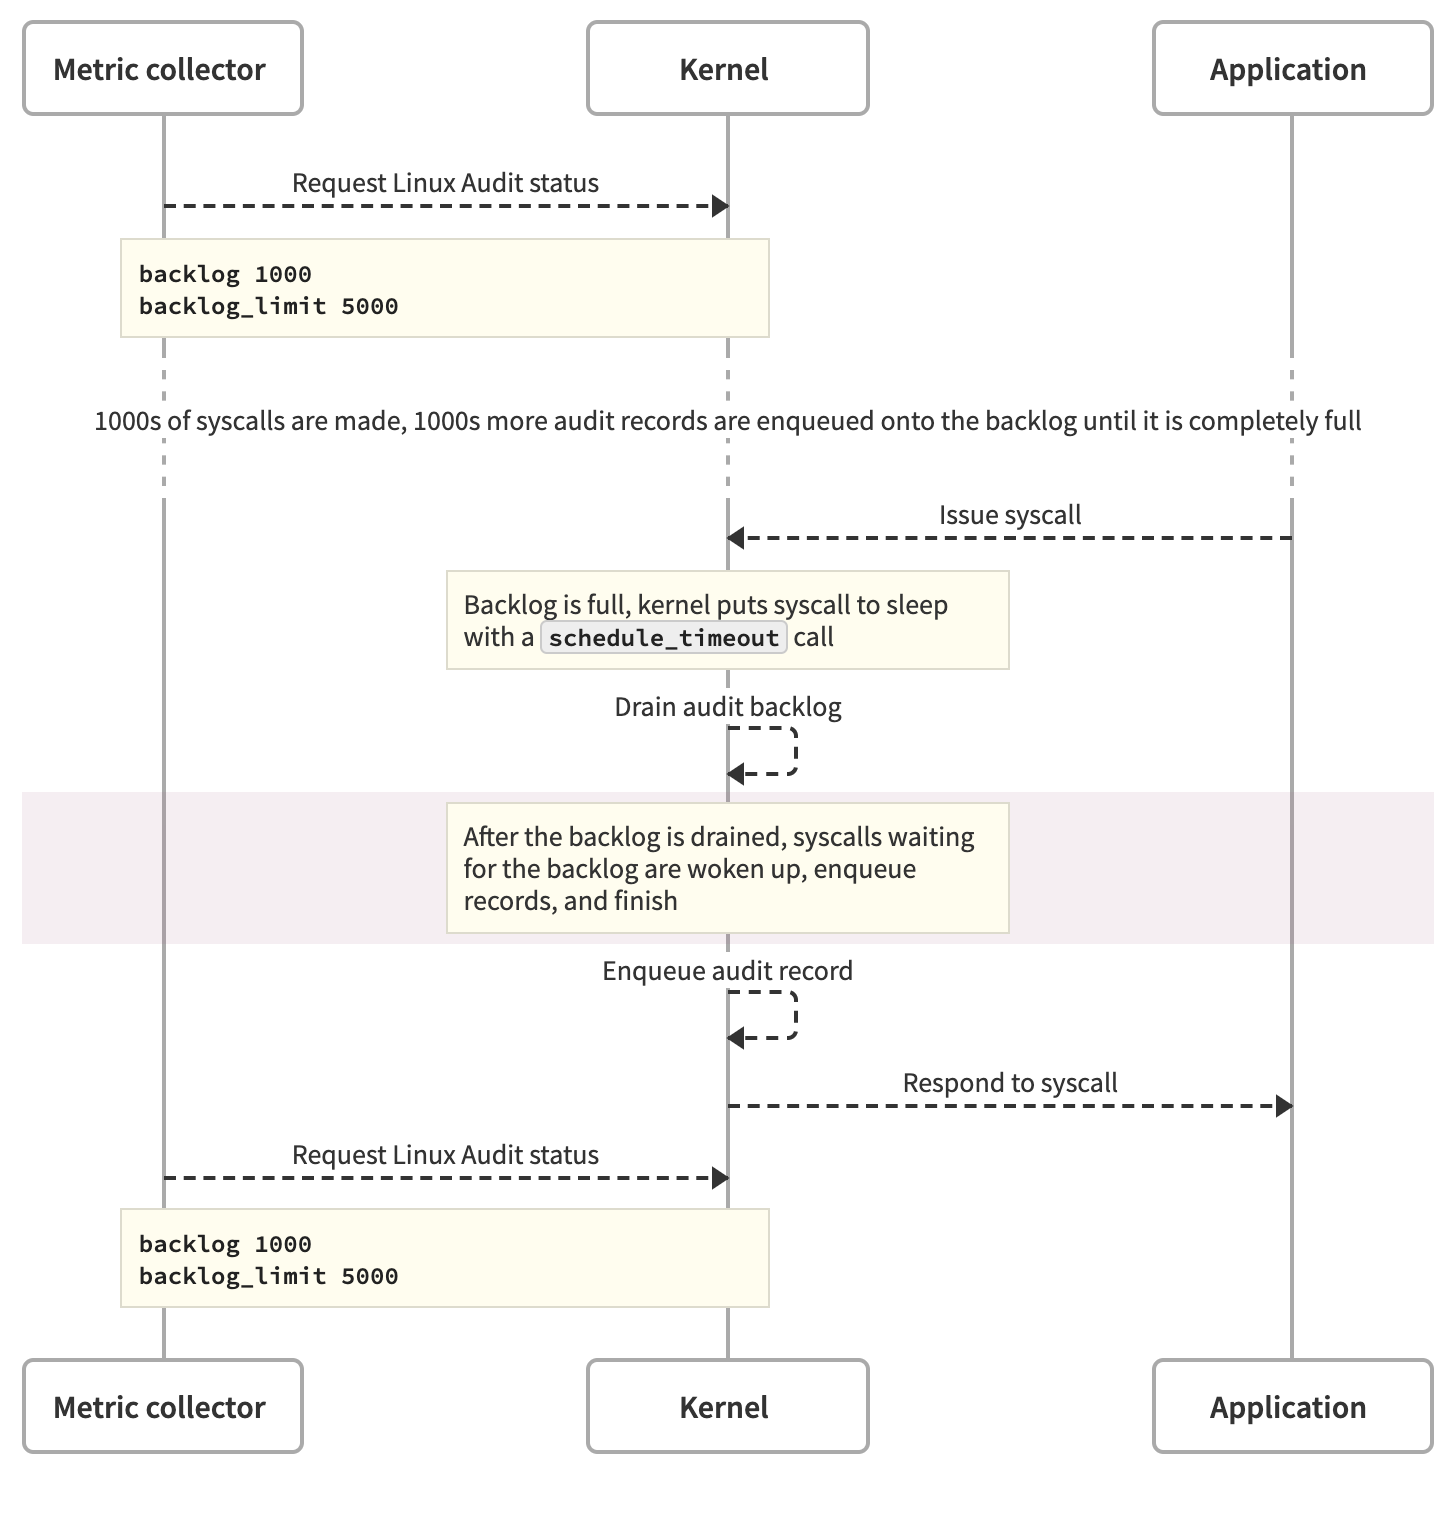
That possibility is why it’s important to also monitor backlog waiting. We contributed the backlog_wait_time_actual counter to Linux, which reports the amount of time Linux Audit spends waiting for the backlog to drain. This counter makes it possible to monitor backlog waiting through the Linux Audit status object.
audit_log_start and eBPF #
Unfortunately, it isn’t available until Linux 5.9, and (at the time of this writing) we’re using AWS stock images running 4.14. Running a user-provided kernel or non-stock EKS AMIs involves more operational responsibility than we care to assume.
So, we looked for another way to gather information about backlog waiting.
What is audit_log_start? #
audit_log_start is the internal kernel function that puts syscalls to sleep when the backlog is full. If this function is slow, there’s a good chance that it’s because the kernel has put the function caller to sleep in order to wait for the backlog to drain.
While imperfect, audit_log_start latency is a reasonable substitute signal for backlog_wait_time_actual.
What is eBPF? #
eBPF is a powerful framework for running safe and performant code inside the kernel. Unlike userspace programs, eBPF programs run inside the kernel, meaning that they can observe kernel behavior without expensive context switches from userspace to kernel mode. Unlike kernel modules, eBPF programs are checked at compile-time by a verifier that forbids unbounded loops or attempts to access uninitialized variables. Additionally, eBPF programs run inside an abstracted runtime context, which requires eBPF programs to access kernel data through safe eBPF helper functions.
These constraints provide a very high degree of safety, at the cost of flexibility. In spite of these constraints, it’s possible to build useful networking, security, and observability tools with eBPF. Check out Cilium, Falco, and Katran.
ebpf_exporter #
We collect audit_log_start latency by supplying this program to ebpf_exporter, which compiles the program and loads it into the kernel’s eBPF virtual machine. We deploy the program and ebpf_exporter together to all of our EKS nodes with this Helm chart.
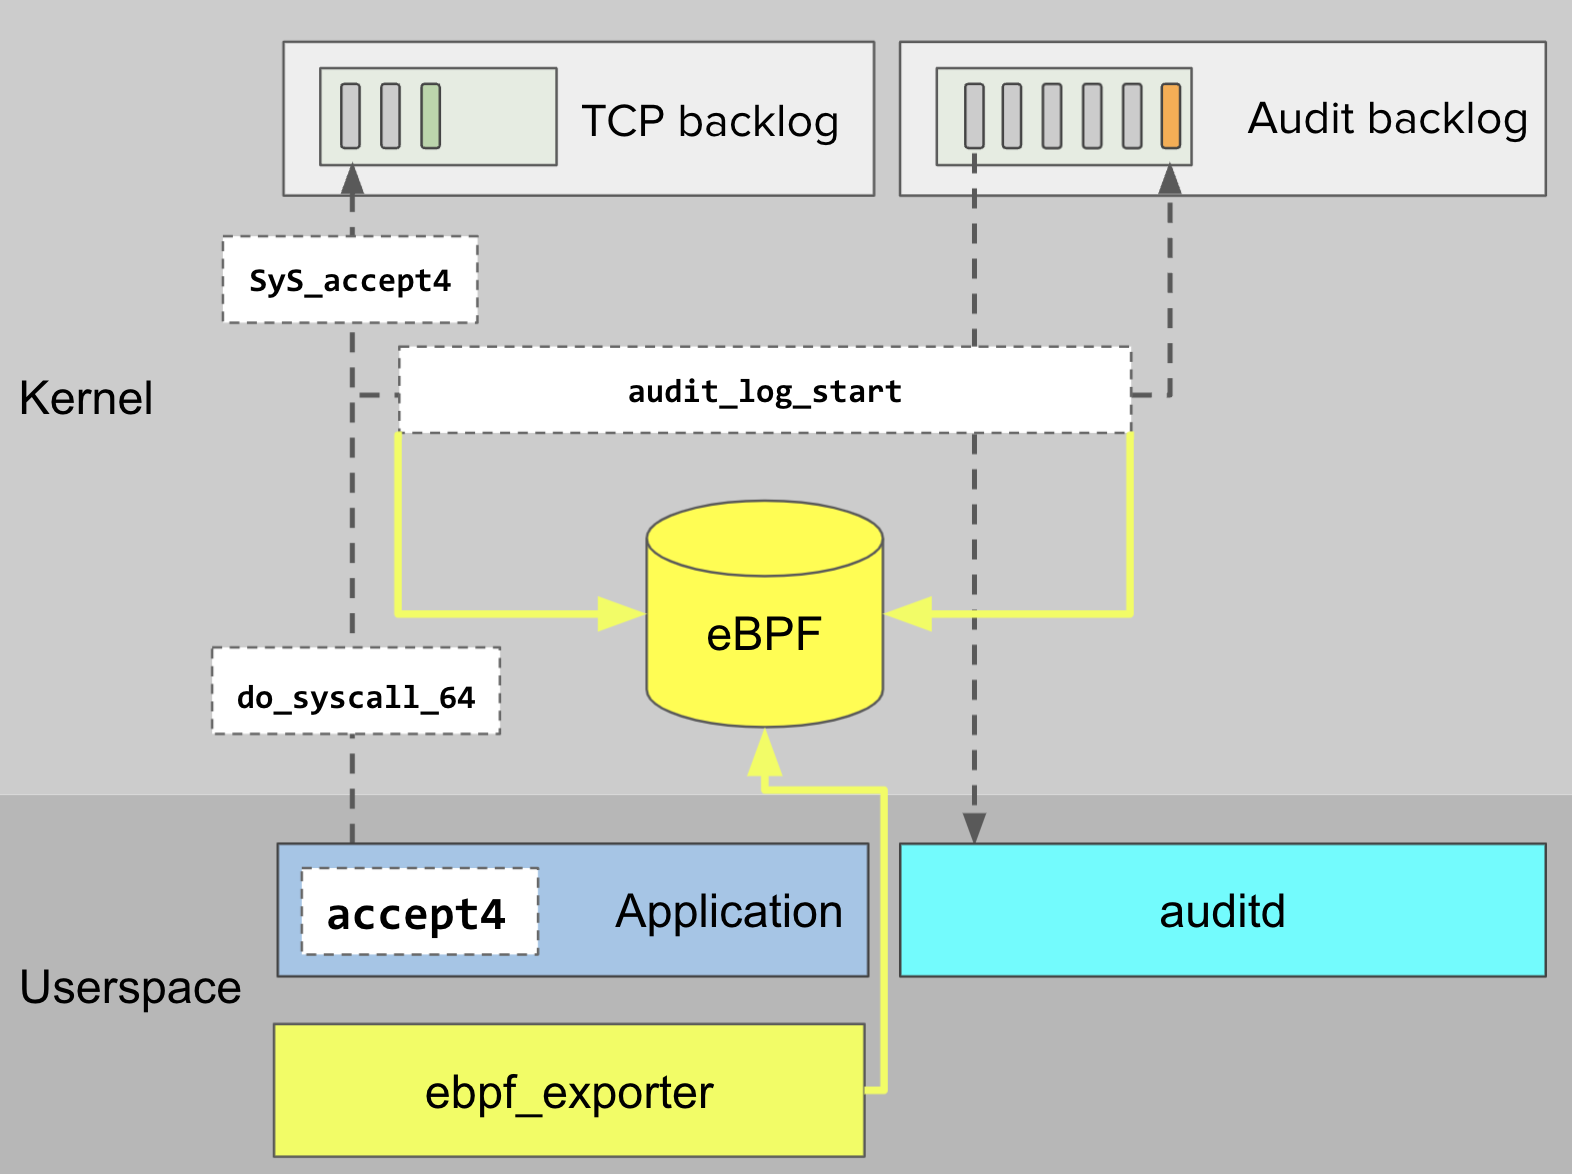
audit_log_start latency, and ebpf_exporter exposes histograms in Prometheus format.Once loaded into the kernel, our program is called whenever a call to audit_log_start starts and ends. Our program uses the start and end time to record the call latency in a histogram. These histograms are exported as Prometheus metrics by ebpf_exporter, collected and monitored by DataDog.
Drawbacks #
Using audit_log_start latency as a substitute for backlog_wait_time_actual does have some drawbacks.
- Imperfect signal.
audit_log_startlatency is not a direct measurement of backlog waiting behavior. Conceivably, latency could spike for reasons other than backlog overflow. It may help to also measureschedule_timeout, and correlate changes to those two measurements. - Maintainability.
audit_log_startis an internal kernel function, and is not a part of the Linux API.audit_log_startis stable through kernel version 5.9, at which pointbacklog_wait_time_actualcan be used instead.
Guidance #
The table below will hopefully guide your selection of tools to measure signals relevant to the risk profile of your Linux Audit configuration.
| Risk | Kernel | Signal | Tool |
| Memory exhaustion | >= 2.6 | Memory utilization | Any Linux monitoring system |
| Lost records | >= 2.6 | Backlog utilization | linux-audit-exporter |
| Syscall delays | >= 4.4, < 5.9 | audit_log_start | ebpf_exporter |
| Syscall delays | >= 5.9 | backlog_wait_time_actual | linux-audit-exporter |