Debugging Distributed Trace Gaps with ftrace
This is part two of a three-part series where we examine “gaps” in our distributed traces.
In the first part, we introduced the problem and used tcpdump to test (and disprove) our initial theory about delays in the travel time of TCP packets across the network.
In this part, we’ll show how we used a tool called ftrace to track the gaps to delays inside the auditing subsystem of the Linux kernel.
In the third and final part, we’ll share some improvements we’ve made to our monitoring system to better detect these kinds of issues in the future.
Recap #
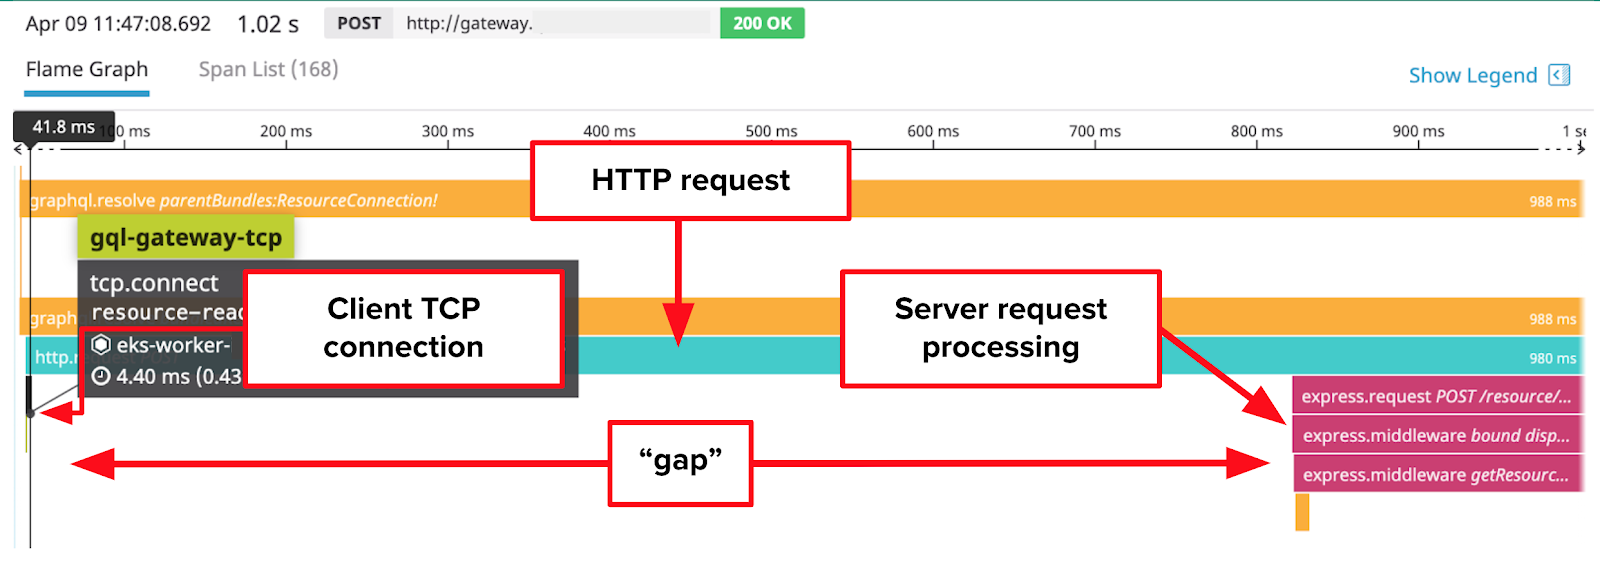
In the previous part, we introduced the problem of “gaps” in our distributed traces for service-service HTTP calls. We formulated a theory that the gaps were caused by delayed travel times of packets sent from the client to the server. We used tcpdump to test that theory:
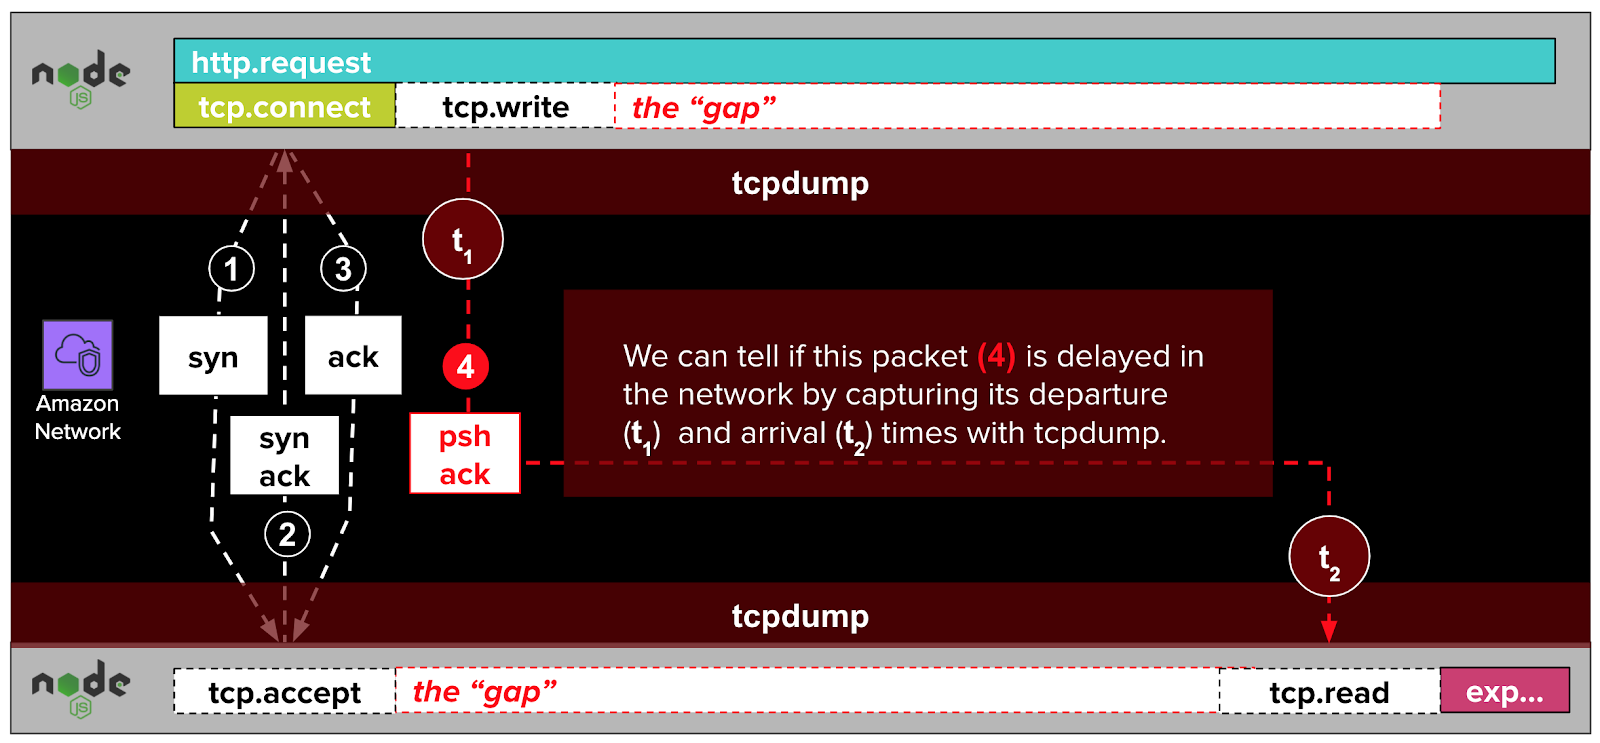
Although data we gathered with tcpdump disproved this theory, it allowed us to eliminate networking issues from consideration entirely, and improved our understanding of the gaps. At this point, our understanding of the gaps is that they:
- Start after the establishment of the TCP connection
- End before the processing of the HTTP request by the express web application
- Have nothing to do with packet delays or networking issues in general
- Are occurring somewhere on the server-side
Maybe it’s the kernel? #
Having eliminated the network as a possible cause, we decided to try isolating the gaps to another large quadrant of possibilities: the Linux kernel.
What is the Linux kernel, anyway? #
The Linux kernel is the part of Linux operating systems with special privileges to execute any CPU instruction, to directly access memory, and to interface with disk and network controllers. The kernel provides abstractions for this hardware which applications interact with through kernel APIs called "syscalls".
How NodeJS interacts with the kernel #
When our NodeJS express web application wants to check for new TCP connections from remote clients, it makes an accept4 syscall to the Linux kernel. When it wants to read in an HTTP request from one of these TCP connections, it uses the read syscall. It responds to HTTP requests and writes logs with the write syscall.
As we noted in the last part of the series, our tracing library — dd-trace-js — cannot observe anything outside of NodeJS. This includes code in the Linux kernel that implements these syscalls.
Any delays in calls by NodeJS to the Linux kernel would manifest as gaps in our distributed traces.
How to observe the Linux kernel #
To determine if the gaps were caused by delays inside the Linux kernel, we needed a tool that could observe what was happening inside of it.
Several tools can do just this. The diagram below by Brendan Gregg shows the landscape of tools that can be used to observe applications, Linux libraries, the Linux kernel, and hardware. Linux kernel encompasses the area between the “System Call Interface” to “Device Drivers”, inclusive (“Linux kernel” annotation is my own). NodeJS and our express web application reside in the “Applications” layer.
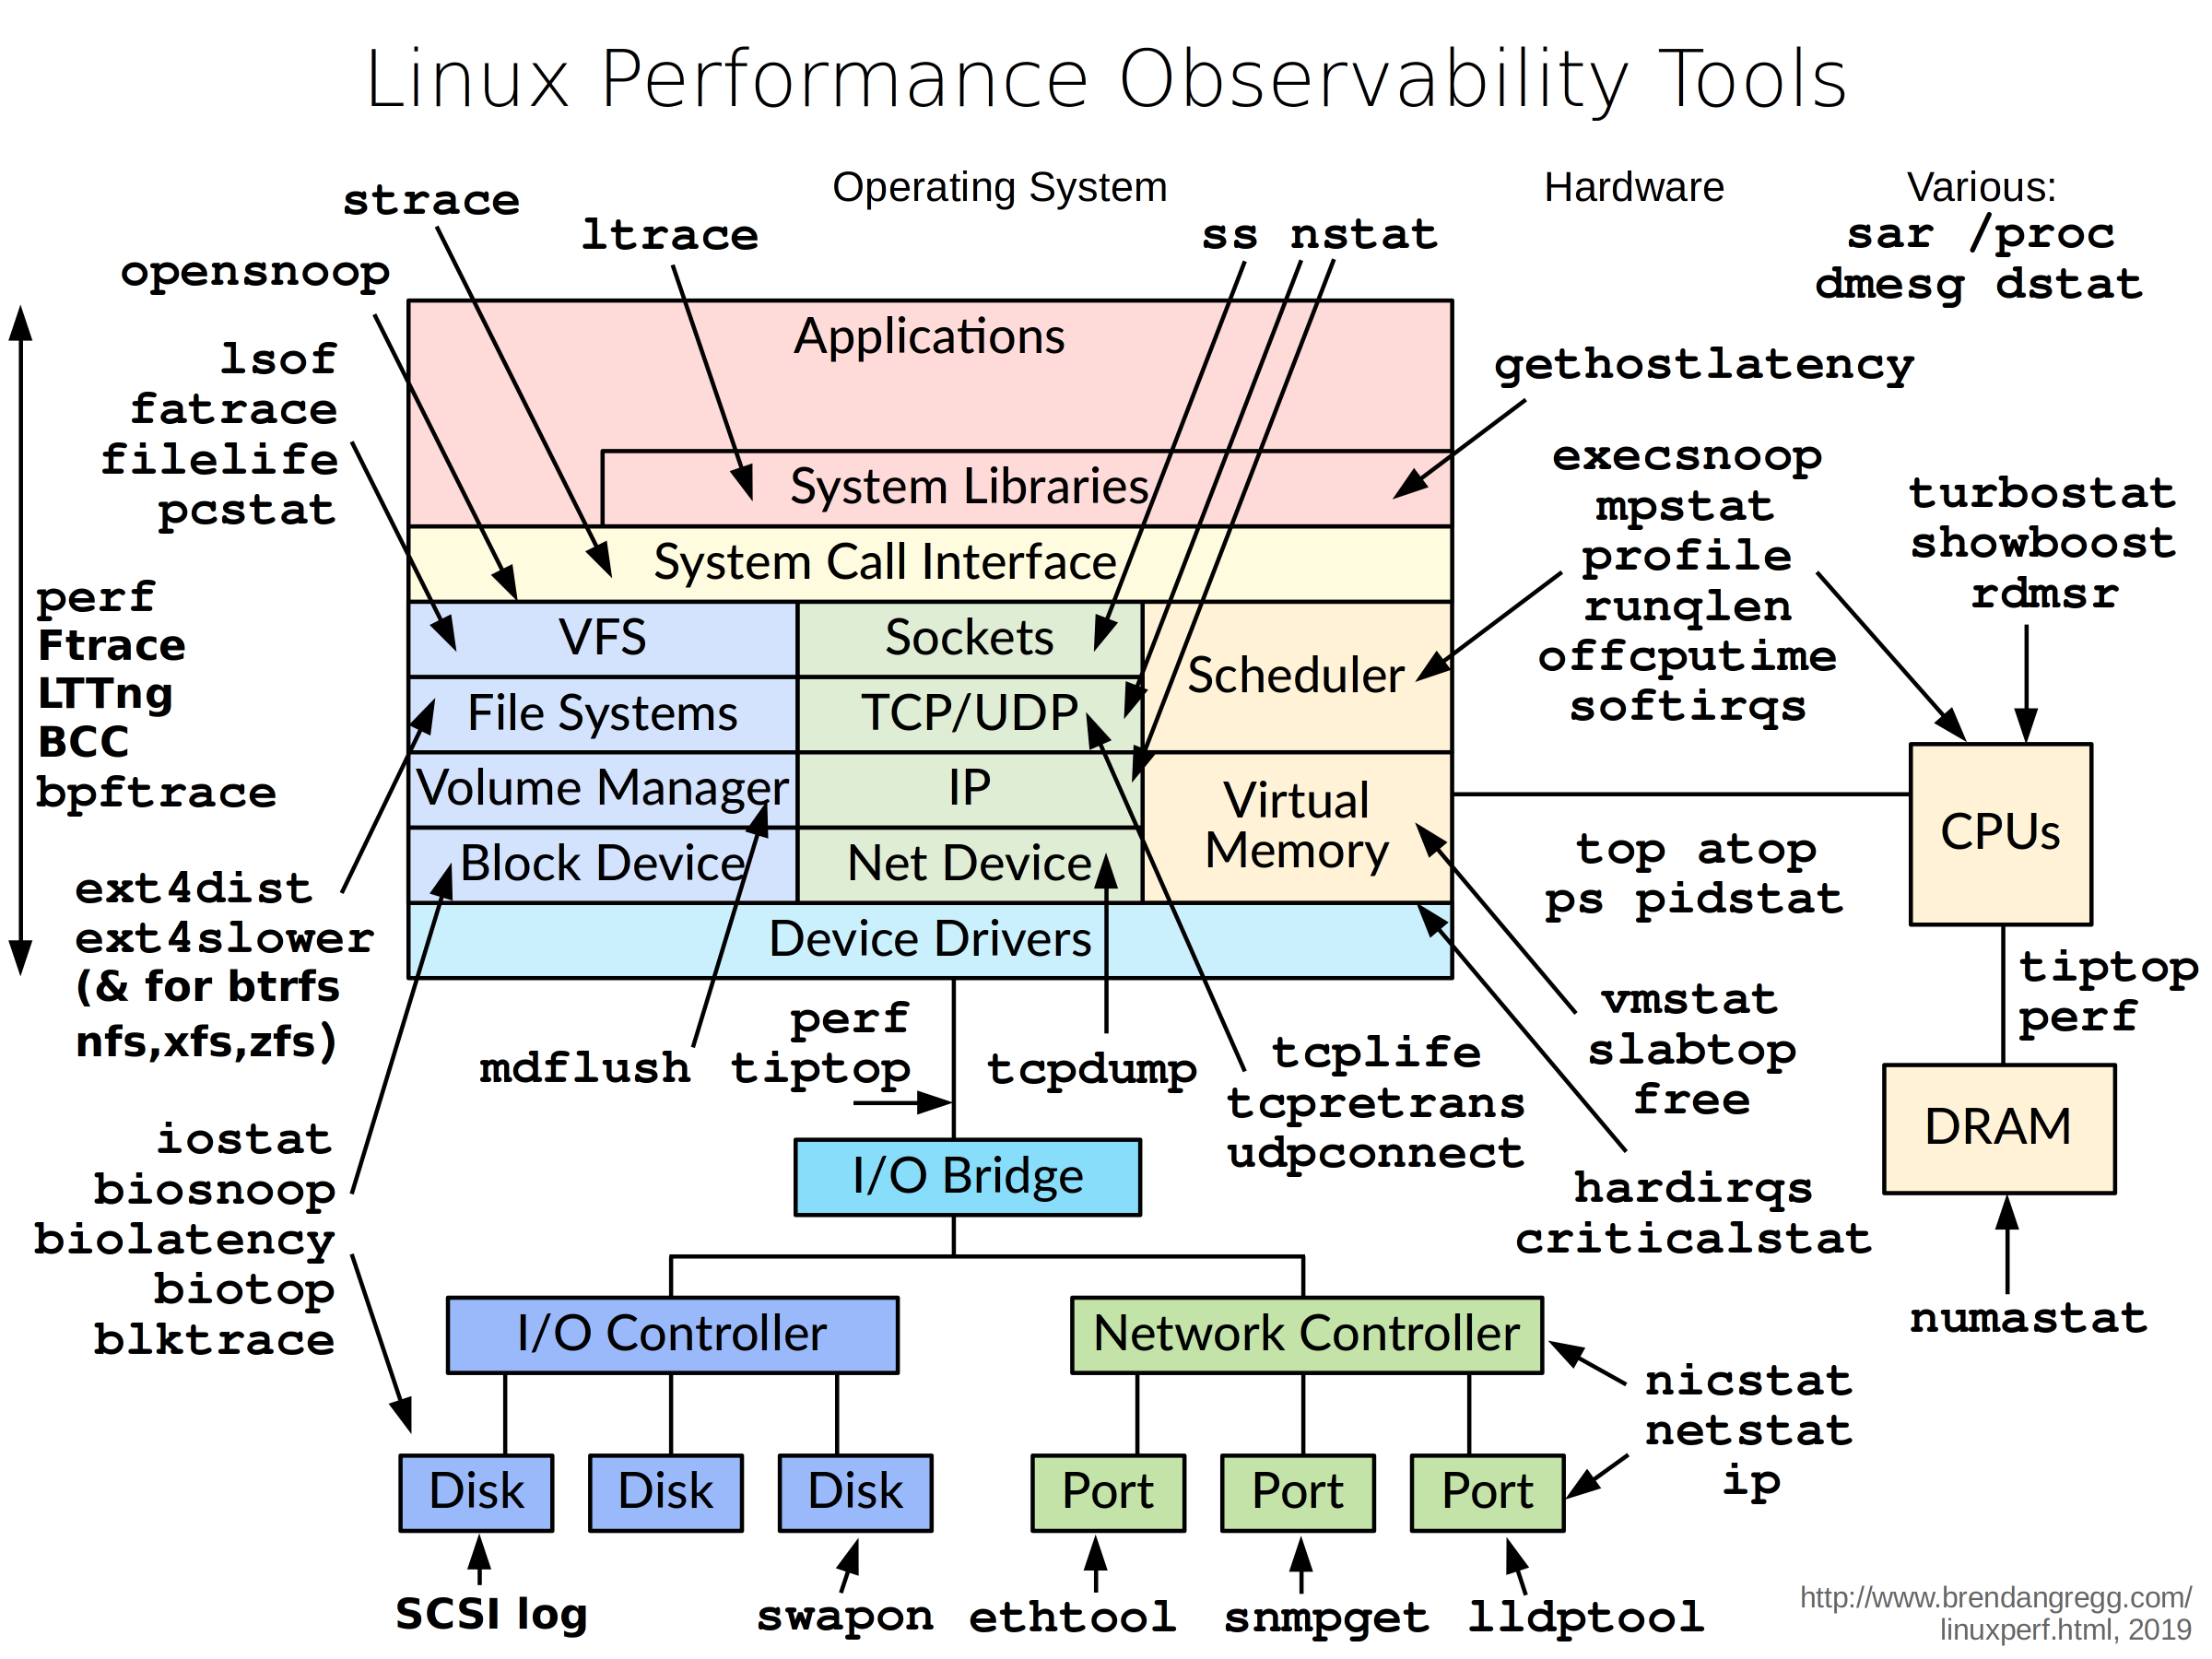
Looking at the available tools in the diagram above, we could see that tools like BCC, bpftrace, ftrace, LTTng, and perf are capable of observing the Linux kernel, and more.
Finding the gap with ftrace #
We ended up uncovering the cause of the gaps with ftrace. Other tools in its class, like perf, would have worked as well. One thing we liked about ftrace, in particular, is that it ships with the Linux kernel and is enabled by default on our Amazon Linux 2 machines.
Tracing for slow functions #
We wanted to:
- Trace one of our express web applications suffering from distributed trace gaps
- Show calls to kernel functions that were taking a long time
The next time we were alerted to trace gaps, we identified its host. Then, we identified the process ID (PID) of the express web application on that host and configured ftrace to capture slow kernel function calls for that PID.
root # cd /sys/kernel/tracing/debug       # Enter ftrace directory
root # echo 0 > tracing_on                # Turn tracing off
root # echo > trace                       # Reset the trace buffer
root # echo function_graph current_tracer # Use function_graph tracer
root # echo 1000000 > tracing_thresh      # Log 1+ second long calls
root # echo <pid> > set_ftrace_pid        # Trace express web app
root # {
> echo 1 > tracing_on                     # Turn tracing back on
> sleep 30                                # Wait 30 seconds
> echo 0 > tracing_on                     # Turn tracing back off
> }
cat trace > /tmp/ftrace.dat               # Copy for offline analysis
Looking at the contents of this 30-second trace, we could spot a problem right away.
# tracer: function_graph
#
# CPU  DURATION                  FUNCTION CALLS
# |     |   |                     |   |   |   |
   2) $ 2025310 us  |           } /* schedule_timeout */
   2) $ 2025313 us  |         } /* audit_log_start */
   2) $ 2025348 us  |       } /* audit_log_exit */
   2) $ 2025350 us  |     } /* __audit_syscall_exit */
   2) $ 2025351 us  |   } /* syscall_slow_exit_work */
   2) $ 2025353 us  | } /* do_syscall_64 */
We can see a stack of function calls, beginning with do_syscall_64 (line 10), and ending with a seconds-long call to schedule_timeout (line 5).
Based on the fact that the schedule_timeout calls were roughly equivalent to the duration of the gaps, we felt confident that these calls were the cause of the gaps in our distributed traces. This was great! Major progress.
Analyzing the trace #
Thanks to ftrace, we now see evidence of gaps within kernel syscalls. However, the new evidence raised new questions:
- What was the purpose of each function in the output above?
- Why was this function
schedule_timeoutfunction being called?
What do these functions do? #
The first thing we wanted to understand was: what was the purpose of each of these functions? Answering these questions was easy enough with Google. We won’t discuss each of these functions in detail; just enough detail to build an understanding.
do_syscall_64 #
The first function, at the bottom of the stack trace, was do_syscall_64. This function is the entry point, or gateway, into the kernel. It’s called whenever an application outside the kernel makes a syscall.
audit_log_start #
do_syscall_64 leads to a call to audit_log_start. This function is part of the Linux audit subsystem , which "provides a secure logging framework that is used to capture and record security relevant events."
schedule_timeout #
audit_log_start makes a slow call to schedule_timeout, which is called when the kernel wants to put the current syscall to sleep.
Why was schedule_timeout being called? #
We now wanted to understand why the audit system was doing that.
From looking at the source code for audit_log_start and referencing the auditctl(8) man page we started to see why.
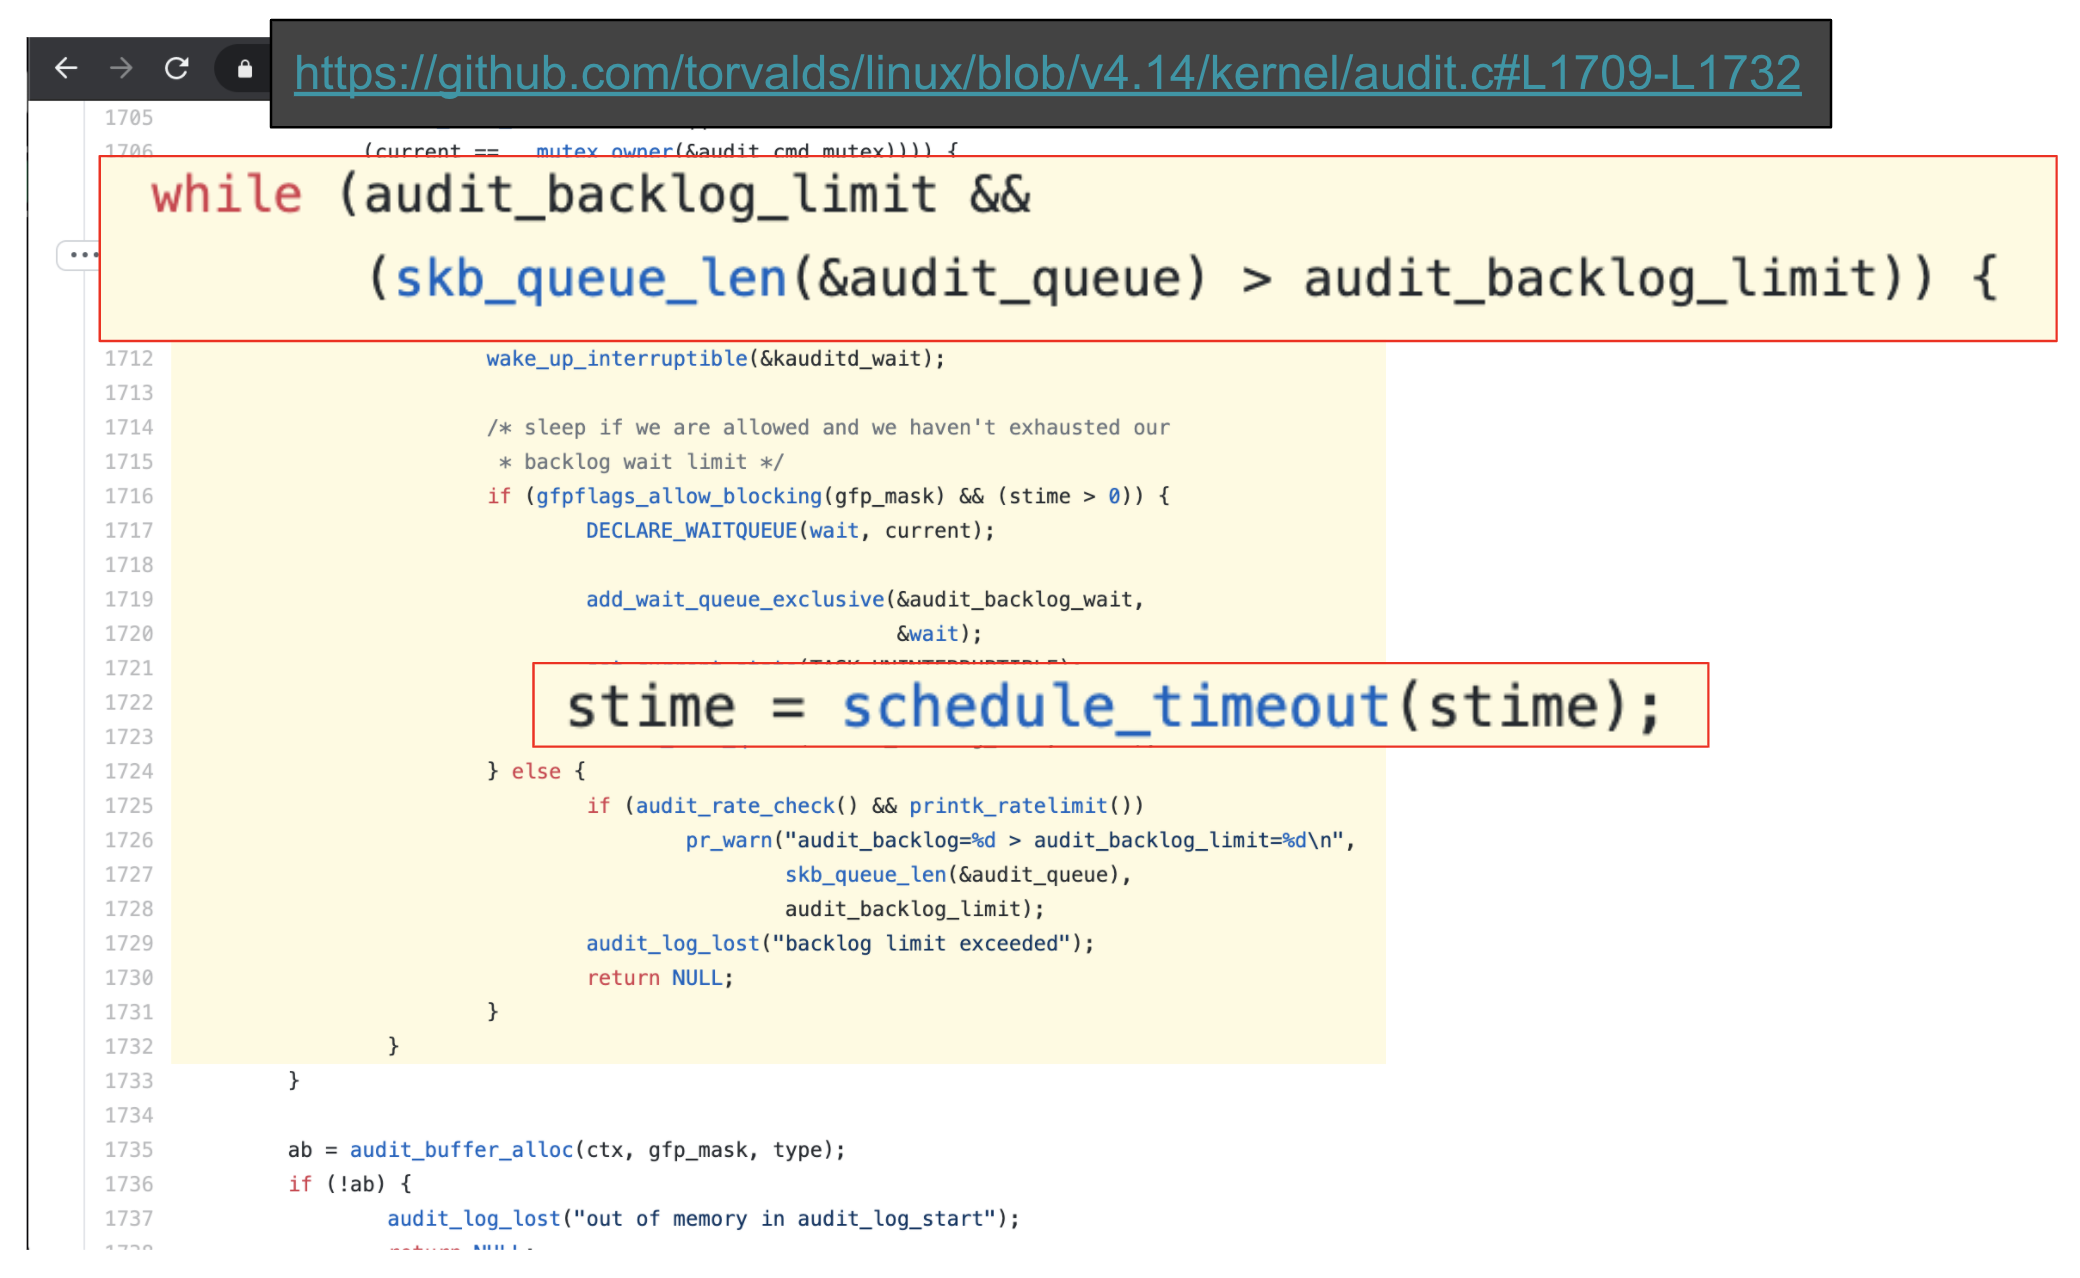
- The audit system events in a backlog, for async processing
- There is a configurable backlog limit, which limits how big this backlog can grow
- When the size of the backlog reaches this limit, the audit system will put the next task that attempts to log an audit event to sleep with
schedule_timeout
Select syscalls sleep for seconds #
Something about this didn’t add up. NodeJS, like any application runtime used to power a web service, makes lots of syscalls. To list a few:
- The
gettimeofdaysyscall is used to get the current time - The
readsyscall is used to read the content of HTTP requests - The
writesyscall is used to write application logs or HTTP responses
If these syscalls were being intermittently put to sleep for seconds at a time, we would expect to see gaps spread all over our distributed traces.
However, we only saw gaps in a specific location: on the server-side, after receiving a TCP connection, and before the connection is handled by express in NodeJS.
So we asked ourselves: were all syscalls being put to sleep by the audit subsystem, or just a subset of them? There were a couple of ways for us to get answers to this question.
Auditing our audit rules #
The audit system is configured with “rules” that govern which syscalls generate audit events. These are (a trimmed down view of) our rules:
root # auditctl -l
-a always,exit -F arch=b64 -S clone,fork,execve,adjtimex,settimeofday
-a always,exit -F arch=b64 -S bind,listen,accept4 -F success=1
Without getting into the weeds to much, here’s what these rules mean:
-a always,exit: Always apply this rule when the syscall exits-F arch=b64: Apply this rule to 64-bit architectures-S <syscall-list>: Apply this rule to the following syscalls
By reviewing these audit rules, which are set by Threatstack (our intrusion detection system), we see that the audit system was configured to generate events for only a small set of syscalls out of the hundreds of Linux syscalls.
The reason for this small rule set is that Threatstack considers these syscalls to be the most significant risk from a security standpoint. This small set also explains why gaps weren’t more widely spread throughout our distributed traces.
Filtering with ftrace #
To narrow things down further, we configured ftrace to see which syscalls preceded slow audit logging. To do this, we:
- Disabled the latency filter (line 2)
- Filtered on syscalls (line 4)
- Set the max tracing depth to 2 (line 6)
This combination of settings ensured that we would only see the syscall entry point (do_syscall_64), as well as child functions called the entry point.
root # echo > trace                            # Clear current trace
root # echo 0 > tracing_thresh                 # Disable latency
                                               # filter
root # echo do_syscall_64 > set_graph_function # Only trace syscalls
                                               # and their children
root # echo 2 > max_graph_depth                # Only trace 2
                                               # levels of calls
root # {
> echo 1 > tracing_on                          # Turn tracing on
> sleep 30                                     # Wait 30 seconds
> echo 0 > tracing_on                          # Turn tracing off
}
root # cat trace > /tmp/ftrace.dat             # Copy the trace data
The output of this trace showed that accept4 syscalls were often followed by slow calls to syscall_slow_exit_work which, as we learned above, puts the syscall to sleep it attempts to put an audit record on a full backlog.
# tracer: function_graph
#
# CPU  DURATION                  FUNCTION CALLS
# |     |   |                     |   |   |   |
 0)                  |  do_syscall_64() {
 0)   0.355 us       |    syscall_trace_enter();
 0) + 64.380 us      |    SyS_read();
 0)   0.932 us       |    syscall_slow_exit_work();
 0) + 67.438 us      |  }
 0)                  |  do_syscall_64() {
 0)   0.184 us       |    syscall_trace_enter();
 0)   1.374 us       |    SyS_write();
 0)   0.463 us       |    syscall_slow_exit_work();
 0)   3.273 us       |  }
 1)                  |  do_syscall_64() {
 1)   0.192 us       |    syscall_trace_enter();
 1)   8.597 us       |    SyS_accept4();
 1) $ 2238253.1 us   |    syscall_slow_exit_work();
 1) $ 2238261.9 us   |  }
From this ftrace capture, we could see that:
The syscall implementations (SyS_read, SyS_write, SyS_accept4) were fast. The one slow syscall (lines 15-19) was an accept4 syscall
What is accept4? #
The accept4 syscall is used to check for and accept pending incoming connections. It fits perfectly into the location of our gaps: on the server, after receiving a TCP connection, and before it is handed off to NodeJS for handling.
NodeJS calls accept4 in non-blocking mode during the poll phase of the loop. This means that, if there are no pending connections, the syscall will return immediately. That is, it should return immediately, if there aren’t other issues, such as a full audit backlog 😉.
Assembling a new theory #
We nearly had enough information to assemble a new theory about our gaps. However, there was still one missing puzzle piece.
Why was the audit backlog filling up? #
A backlog, or queue, will fill up when the consumer cannot consume events as quickly as the producer.
In our case, the producers of audit events were our applications, including our NodeJS express web application. Threatstack consumes the audit backlog and to detect malicious behavior.
When we asked Threatstack about this issue, they suggested that the threat analysis agent might not have enough CPU resources to process audit events quickly enough. This seemed plausible, and an inspection of our Linux CPU throttling metrics supported this theory.
The throttled, the full, and the sleepy #
Putting together all of the pieces we had gathered with help from ftrace, Google, and Threatstack, we now had a new theory that:
- Our Threatstack agents were getting CPU-throttled
- This meant it could not process audit events as fast as they were generated
- As a result, the audit backlog would fill up to its limit, and
- When syscalls such as accept4 attempt to enqueue an audit record,
- The audit system would put those syscalls to sleep
Visualizing the theory #
With so many moving pieces, visualizing them will make the whole story more clear.
When all is well... #
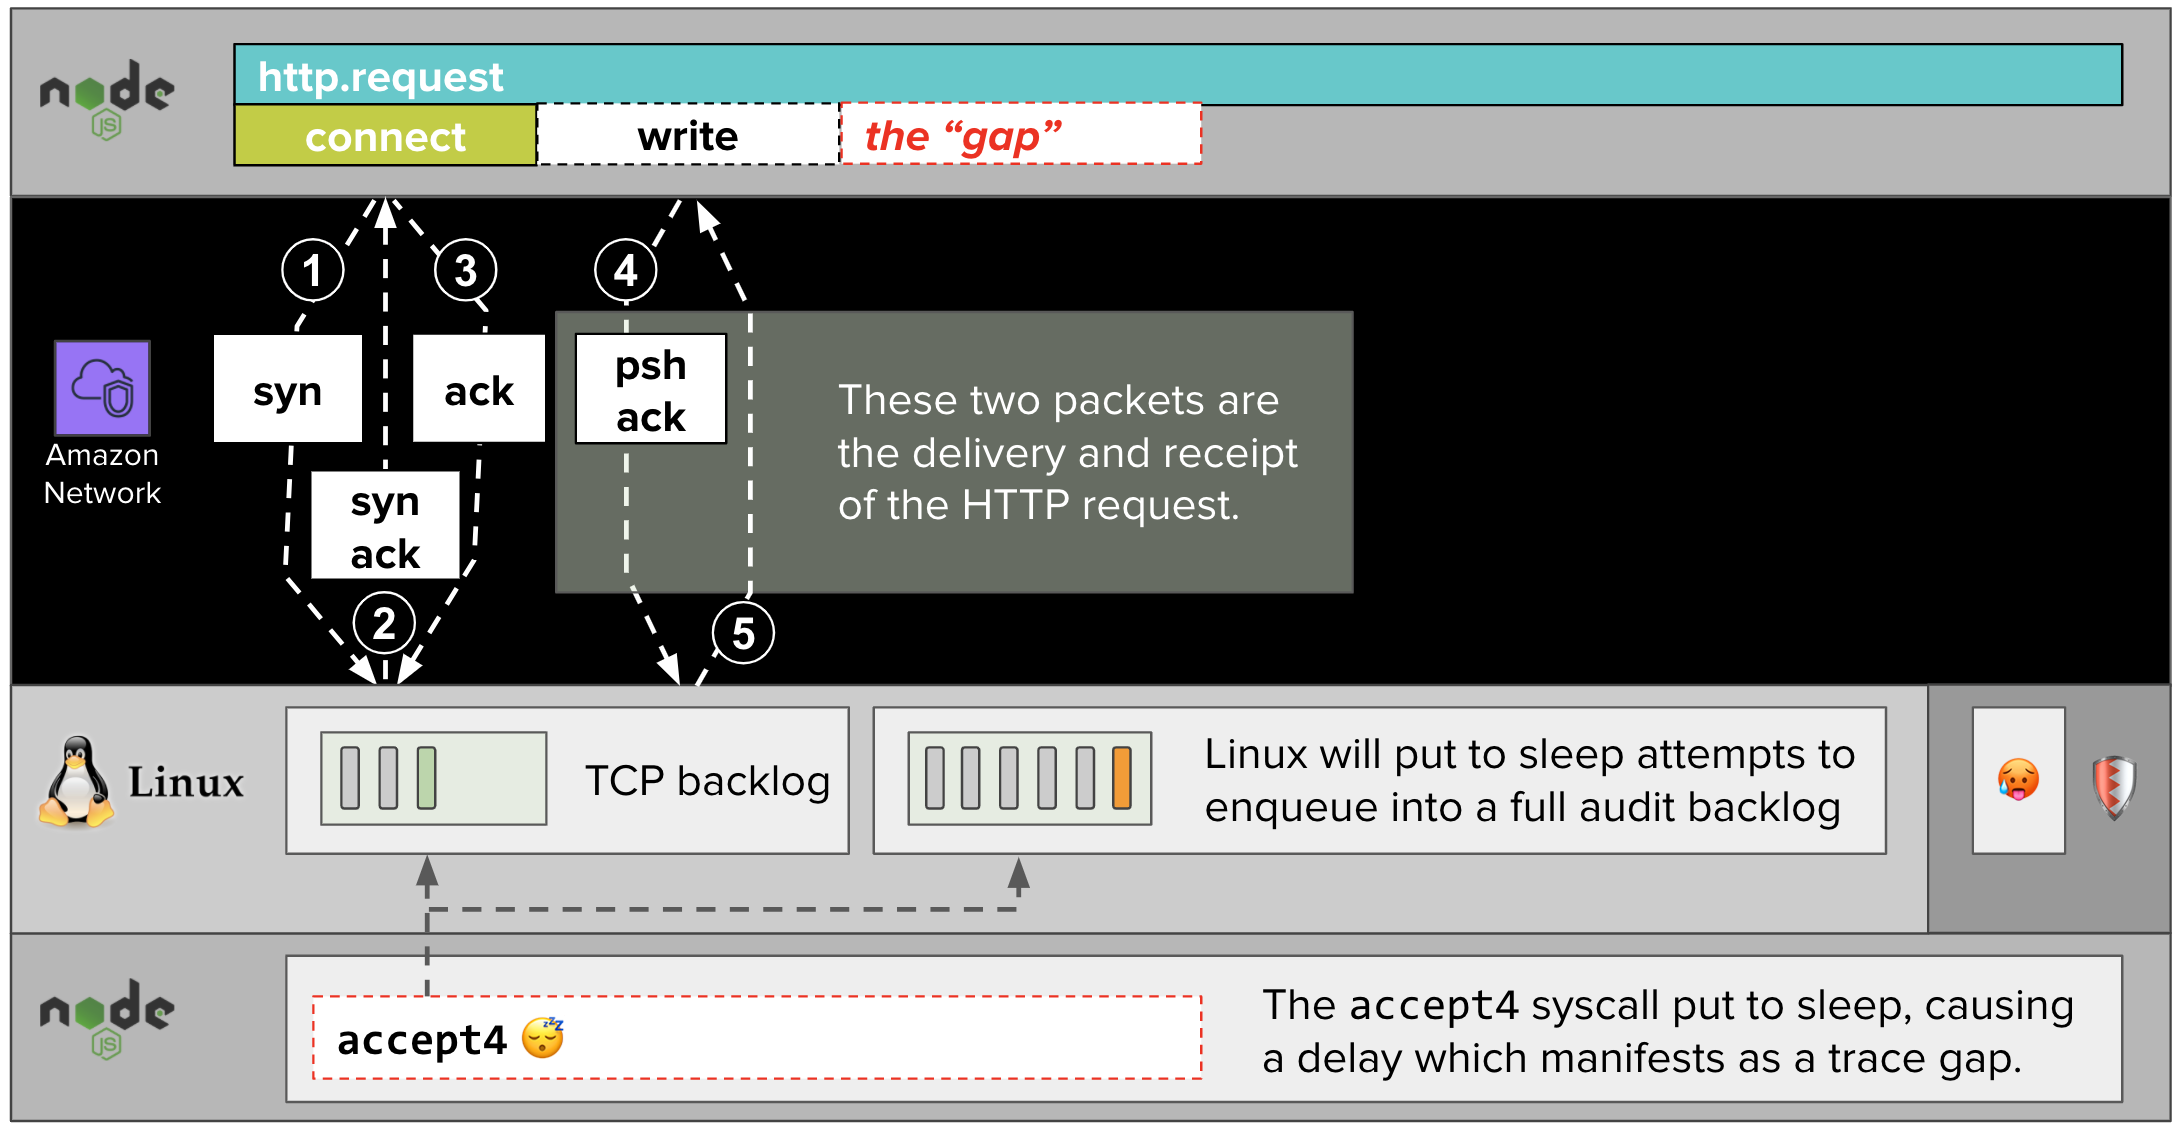
A remote client makes an HTTP request to our NodeJS express application by first establishing a TCP connection with a connect syscall. In the previous part, before we had introduced syscalls, we labeled this span as tcp.connect in diagrams.
When Linux receives the connection, it puts it onto the TCP backlog (separate from the audit backlog) of the express web application.
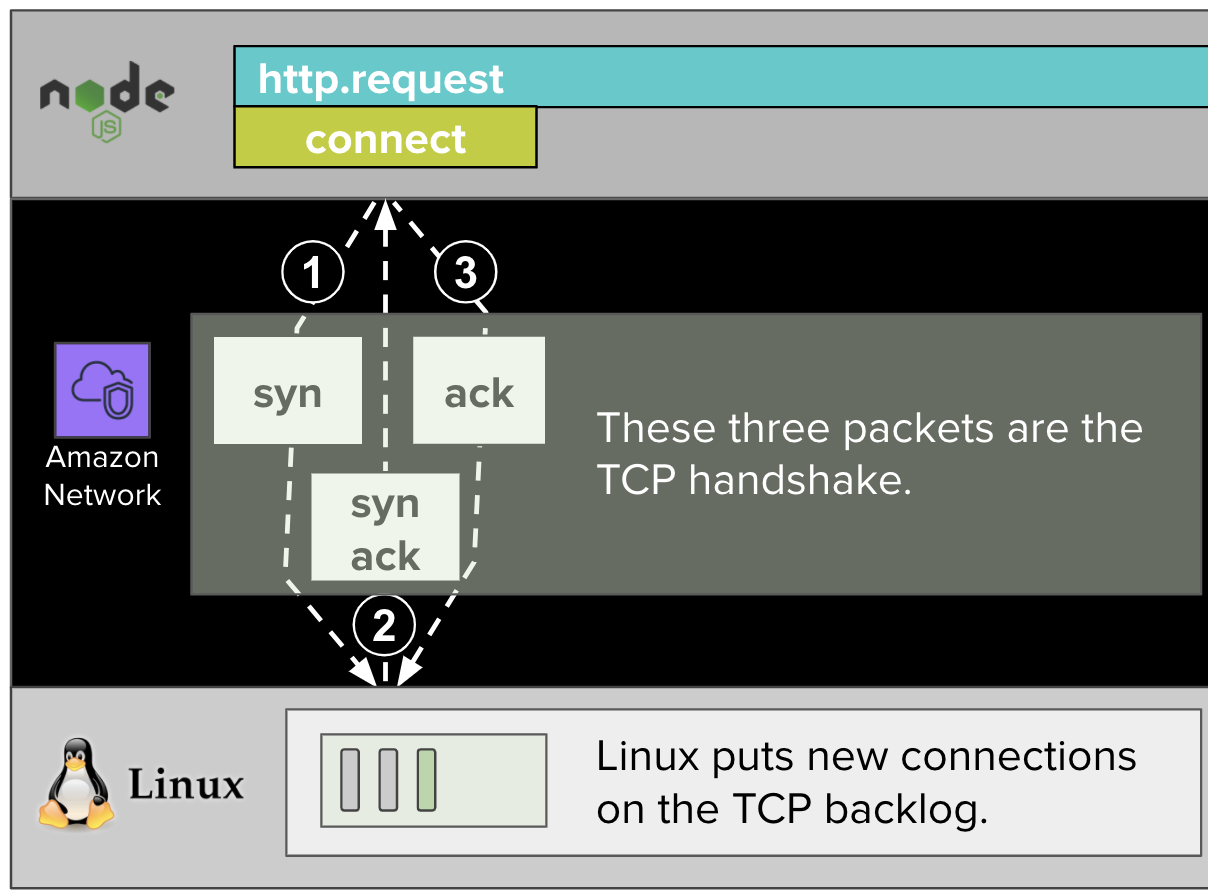
The NodeJS process running our express web application will periodically poll this TCP backlog for new connections with an accept4 syscall. (In the previous post, we labeled this as tcp.accept in diagrams.)
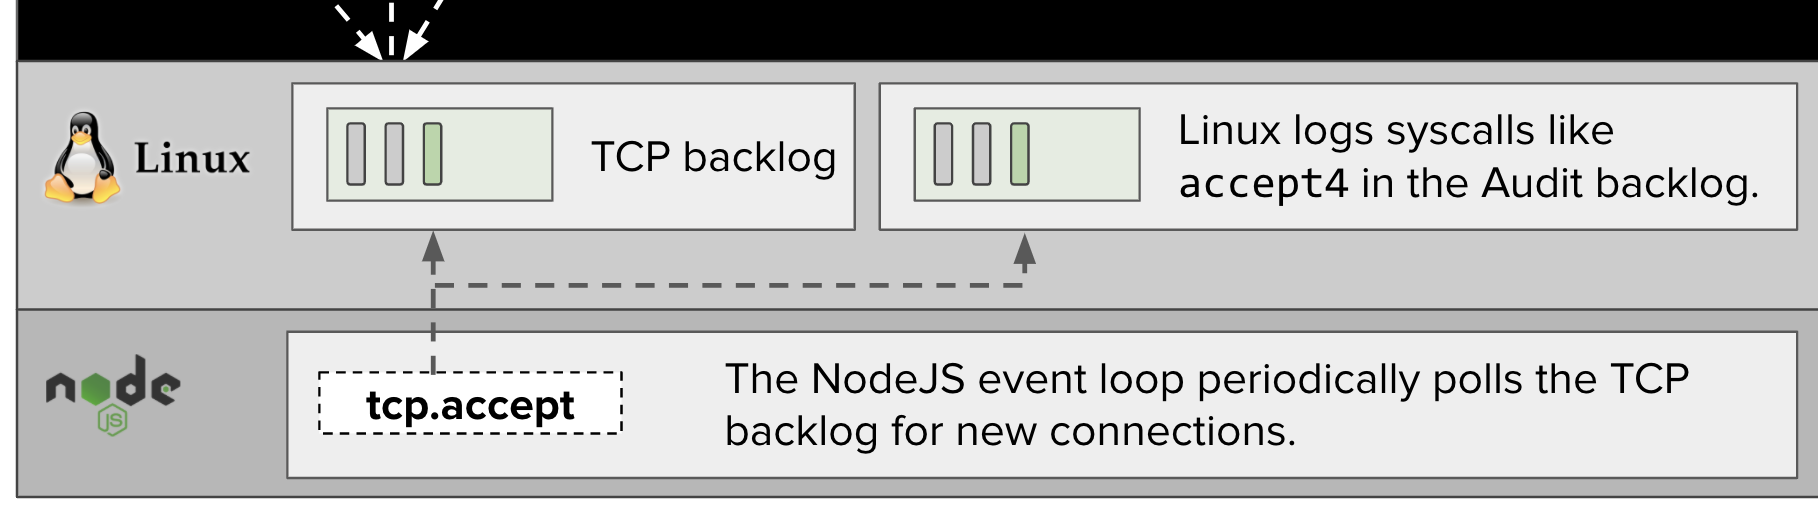
When an accept4 syscall is made, our audit rules will cause an audit event to be placed in the audit backlog.
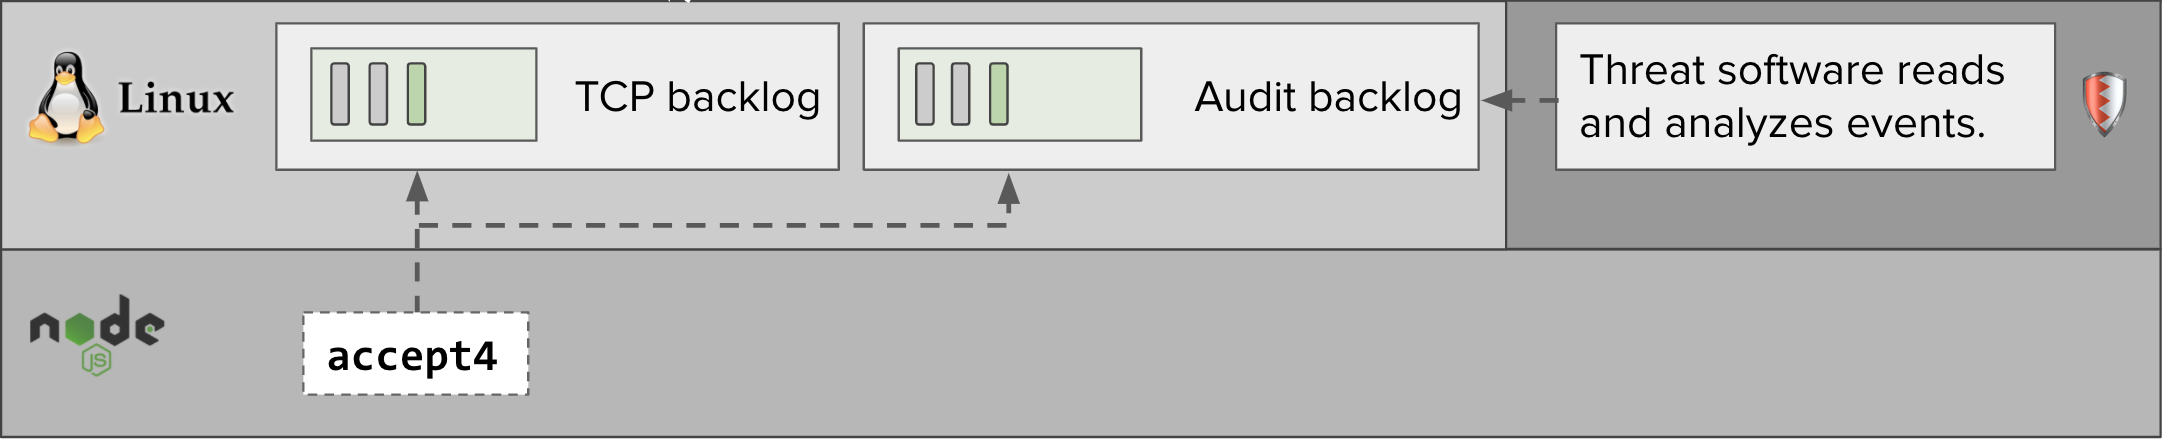
The Threatstack agent will process events in the Linux audit backlog, analyze the events, and alert us if it detects any potentially malicious activity.
Where things go bad... #
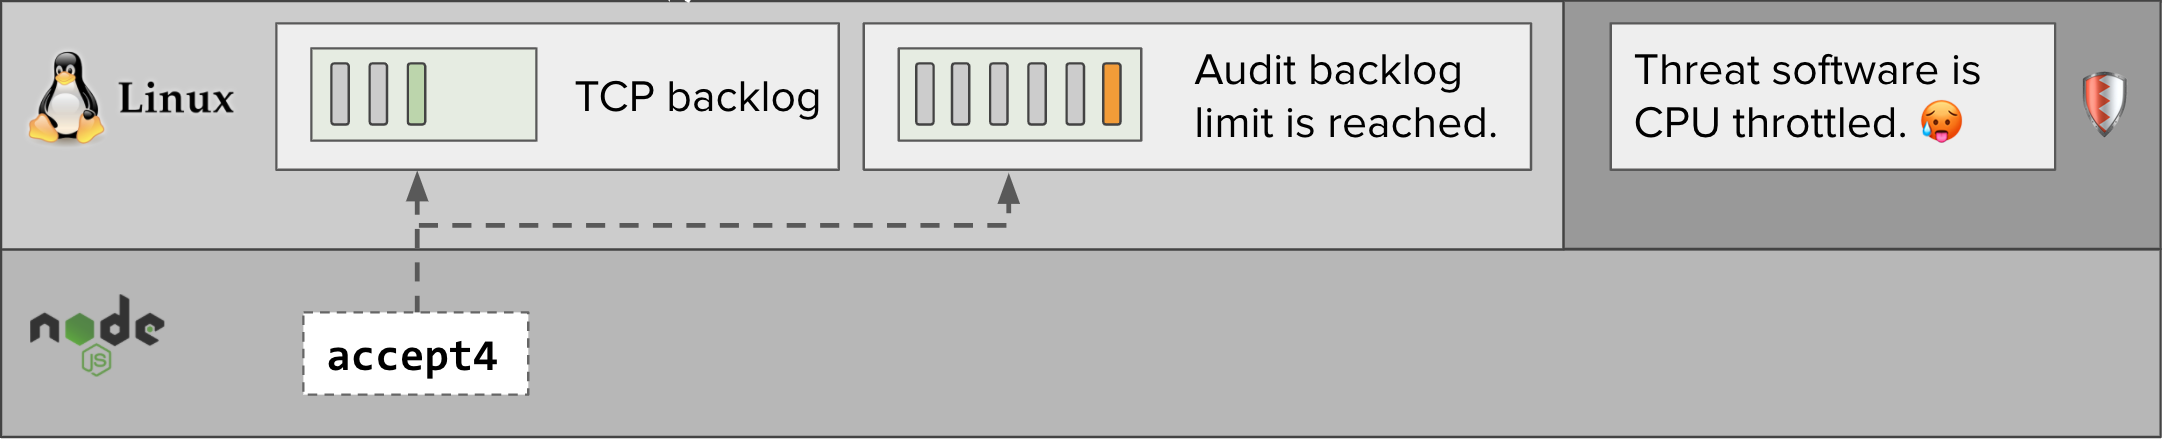
During periods of heavy user traffic, higher volumes of audit events are generated. The Threatstack agent, which runs in a Docker container with CPU limits, can be CPU throttled by Linux depending on how its resource limits are configured. While this happens, the Threatstack agents can’t read events from the Linux audit backlog, which fills up and reaches its limit.
When the NodeJS application makes an accept4 syscall while the backlog is full, the Linux audit system puts the accept4 syscall to sleep with schedule_timeout. While the accept4 syscall is asleep, the express application cannot read the HTTP request which the remote client has written to the TCP connection.
Our distributed tracing library, dd-trace-js, does not have visibility into this delay, which manifests as a “gap” in our trace visualizations.
When the next CPU quota period begins, Linux stops throttling the Threatstack agent, which then clears the audit backlog. When the audit system sees that there is now space on the audit backlog, it wakes up the accept4 syscall, which finishes enqueuing a new audit event.
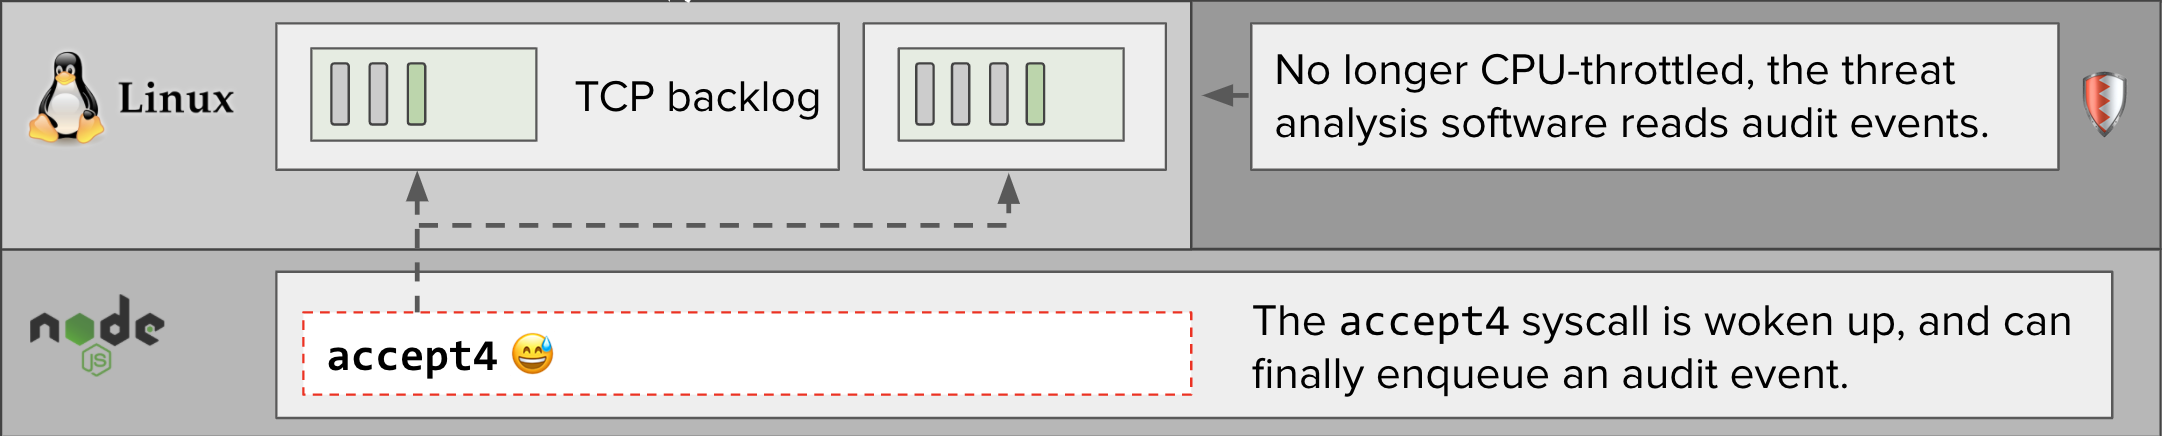
At that point, the express web application can finish reading and respond to the HTTP request. By now, however, seconds may have elapsed since the remote client initiated the TCP connection.
Testing and fixing #
Testing this theory, and fixing the problem, was quick and easy. We increased the CPU limits of our threat analysis software, as recommended by Threatstack. After doing so, it was able to keep up with the high volume of audit events generated during peak hours, without getting CPU-throttled by the kernel. As a result, the gaps in our traces disappeared, and application performance returned to normal.
What’s next? #
Although increasing the CPU resources of the Threatstack agents fixed the problem in the short term, we didn’t consider the case closed. Hypothetically, future increases in syscall activity due to user growth could again produce CPU-throttling and audit backlog saturation. We also wanted to apply the lessons we learned more broadly, for example by looking for syscall delays caused by things other than the audit subsystem.
In the next and final part of this series, we’ll share how we made improvements to our system monitoring to be able to better detect and debug this issue in the future.