What Lurks Within: Reducing Bundle Sizes With Webpack Bundle Analyzer
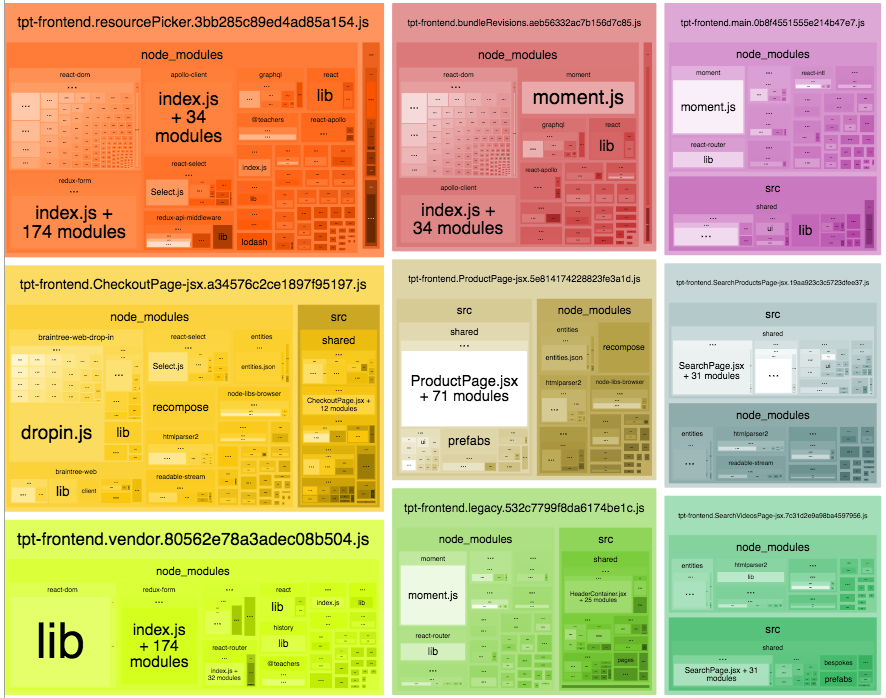
At Teachers Pay Teachers (TpT), we use React, Webpack, and ES6 modules to build both our frontend code executed in user’s browsers and also much of what we render serverside. By managing dependencies using NPM (and/or Yarn), we can easily introduce third-party libraries. Where in the past, developers would manually download and add dependencies, it’s now as easy as typing yarn add X. But with this comes a downside: the process of adding third-party code has become less intentional, and it is no longer trivial to calculate the code weight of a new dependency. It’s easy to quickly see the size of the distributed version of jQuery, but less so to find the size of a third-party ES6 module, after tree-shaking, and after accounting for any new transitive dependencies it might add. Thankfully, other tools have evolved to help with this issue, and in this post I’ll be discussing one such tool--Webpack Bundle Analyzer--and a few tips for using it to hunt down unexpectedly large dependencies.

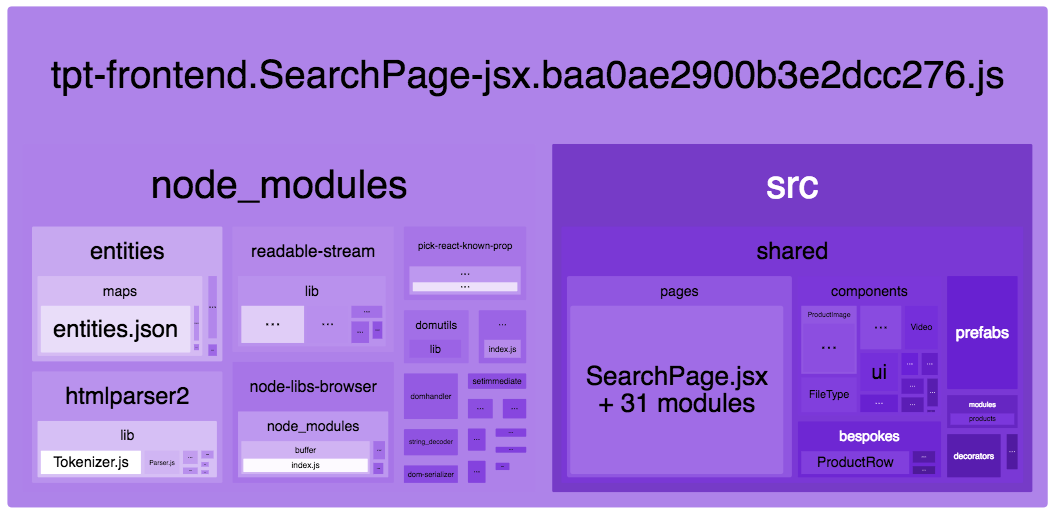
Webpack Bundle Analyzer provides a simple (and visually pleasing) way of seeing the constituent parts of a project’s bundled code. It displays packages using a treemap visualization that makes the relative size of dependencies immediately clear and tangible. After setting up Webpack Bundle Analyzer at TpT, we quickly identified some unexpected issues. One of the biggest of these problems became clear after a short glance at this zoomed-in view of a particular bundle:

We split our code into multiple bundles that are optimized for long-term caching, including a vendor bundle where we place our most widely-used (and rarely changed) third-party dependencies. Because of this, most of our other bundles consist chiefly of our own code. But for this particular bundle, Webpack Bundle Analyzer shows that there is a more or less 50:50 split between first-party code (in the /src subtree), and third-party code (in /node_modules). This is because there are some pretty large extra third-party dependencies here: htmlparser2, readable-stream, and node-libs-browser.

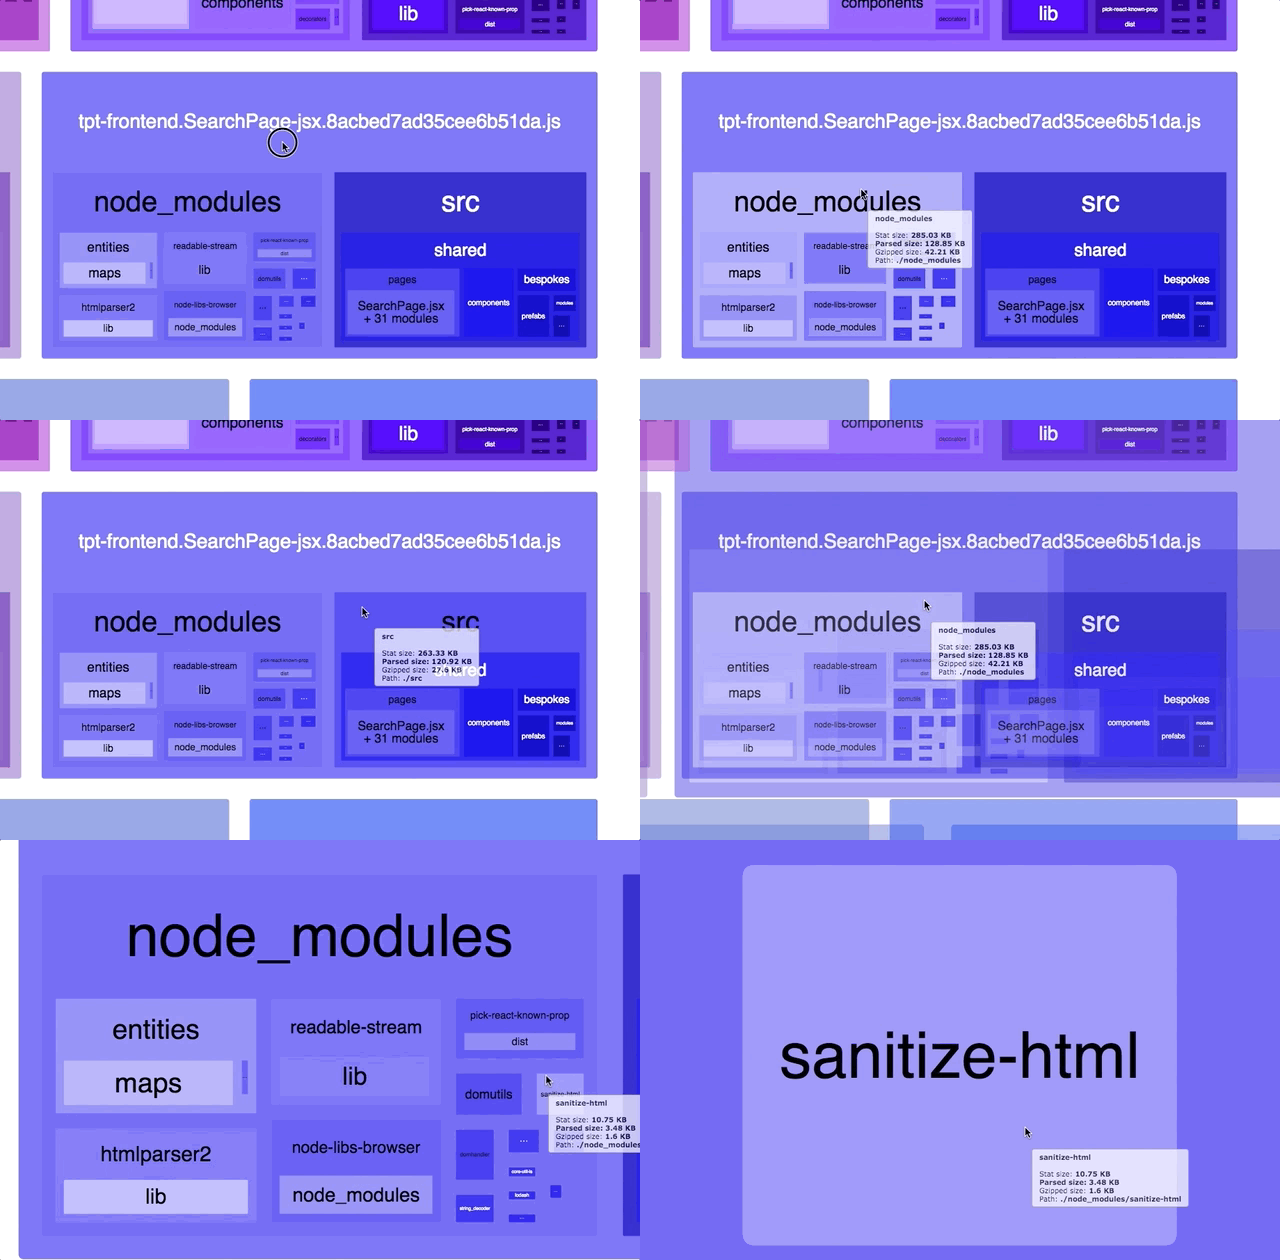
A quick search through our codebase (just by grepping for each of the module names; the built-in search on Github would have worked equally well) revealed that there was no place in which we directly imported any of these big dependencies. But when we zoomed in further, we saw something that we did intentionally import: sanitize-html. As you might guess, we use it to sanitize and prevent security issues in user-provided HTML. As you might not immediately guess, this library was originally intended for use via Node, not via the browser. So why was it so easy for it to slip into our clientside bundle, and why does it even work outside of Node?
The answer lies partly with a very helpful, and not very obvious, Webpack feature: automatic Node polyfilling, which is enabled by default. sanitize-html makes use of htmlparser2, which makes use of Node’s built-in Buffer class. In the browser, Buffer does not exist, but it turns out that Webpack takes the trouble of automatically adding it in for us via node-libs-browser. And htmlparser2 itself pulls in readable-stream, a browser-compatible version of Node’s built-in Stream interfaces. Each of these choices made it easy for us to shoot ourselves in the foot and send a lot of heavy code intended for serverside use to our user’s browsers.
Now, that was a particularly weird issue and not necessarily one your own team is likely to encounter. But after setting up Webpack Bundle Analyzer locally and discovering a few issues like the above, we took some further steps that may be worth considering for your own team:
Make Bundle Contents Visible To Everyone #
We set up a hosted Webpack Bundle Analyzer report that is automatically updated when we deploy code changes, and that anyone on the team can quickly visit in a web browser.
This gives our developers more awareness of what’s in our clientside bundles, and by making the dependency graph more palpable, raises the likelihood of any given developer finding an area that we can optimize further.
Make Sure You’re Not Unwittingly Using Serverside Functionality on the Client #
Based on what we found in Webpack Bundle Analyzer, we started updating our HTML sanitization approach to sanitize on the API side, rather than on the client. In the past, the conventional wisdom usually called for escaping and/or sanitizing output at the layer closest to where it was displayed. But with clientside rendering, we found that there are cases where the cost of sanitization in the browser can exceed the benefits of doing so. (As seen in the 70KB+ of extra dependencies that we introduced by using sanitize-html on the client)
Tell Webpack That Good Friends Don’t Enable Bad Decisions #
Once you’ve eliminated any dependency on Node libraries in your clientside code, setting node: false in your Webpack configuration will help prevent in-browser Node polyfills from slipping in in future (you’ll see an error message instead of an unsightly, bloated bundle).
Unexpected serverside code on the client was the biggest and most interesting problem we found in our own codebase, but the analyzer also helps to find and fix more mundane performance issues. For example, we were using an old version of recompose and importing the entire recompose library, and this manifested in a visibly huge square of the Webpack Bundle Analyzer report. Updating to a newer version that tree-shakes properly significantly reduced our bundle size.
Combined with some tools we already had in place (such as a reporter similar to bundlesize, which displays changes in clientside bundle directly on GitHub Pull Requests), and practices we had already adopted, such as code splitting, Webpack Bundle Analyzer has given our developers better ability to confidently make clientside changes while understanding their impact on bundle size and page load time. If you’re also using it and have any comments, questions or particularly strange or pretty charts to show, we’d love to hear from you in the comments below!
Thank you to Ryan Sydnor and Emily Schaefer for providing great feedback and edits on this post!