Challenges faced while scaling to serve millions of views per day on AWS using Kubernetes, React, PHP, and Elixir
Here at Teachers Pay Teachers (or TpT, as we call it) we’ve been in the process of migrating our website from a PHP monolith to a microservice based architecture utilizing React, Phoenix and GraphQL. To date, this migration has delighted our community of educators with it’s myriad of UX improvements. We're able to objectively measure these improvements with our A/B testing infrastructure which also enables us to gradually expose functionality to broader and broader levels of traffic.
Our product page receives ~2 million pages views per day making it the most heavily trafficked page on TpT (here’s an example page). We decided to use a simple UI refresh as an opportunity to migrate the page to our new tech stack. This post dives deeply into the challenges we overcame while scaling the product page on our new infrastructure!
Timeline of key milestones #
March
Add feature flag
Set up our infrastructure to support routing between the new page and old page based on a feature flag. Opt-in the core team.
Add Administrators
Most of our employees internally are administrators on the site. We opt in all employees to the new experience and encourage them to help us stress test!
Begin adding BETA users
We've told our community about the upcoming changes and some of them volunteer to help us work out the kinks. Opt in approximately 500 beta users and begin collecting feedback.
April
1% of all traffic
We release to 1% of all traffic. Everything looks good!
5% of traffic
We start to see a couple of new JavaScript errors come in and fix the browser compatibility issues quickly.
Routing issues
We see some sporadic 500s coming in and determine there are some routing issues that we need to work out.
20% of traffic
Now that the routing issues are under control, we ramp up a bit more and things are looking good!
30% of traffic
Things look good!
40% of traffic
Things are looking good...
Ramp down to 10% of traffic
During our morning traffic spike, we began seeing a steady stream of 504s from our Elixir Graph API Better scale back and dig in.
50% of traffic
Once we resolved the 504s issue, we slowly ramped back up to 50%.
May
Resizable image server CPU overload
We were seeing extremely high CPU on our servers that dynamically resized images.
Ramp down to 0% for the sale
With our Teacher Appreciation sale right around the corner, we didn't want to risk anything going wrong due to unknown unknowns in dealing with the heavy traffic generated during the sale.
500s under load at 60%
We brought traffic back up after the sale and thought we were in the clear until we had a surge of traffic in the evening that threw a couple hundred errors. We ramped back down to 50% to investigate.
Spikes of errors just after scaling
After scaling back up by just 5% from 50->55%, we saw approximately 200 errors occur. We wrote them off as deployment artifacts. When we decided to continue scaling from 55->60% and saw approximately 1500 errors occur, we decided to dig into the spikes of errors.
100%
Once we resolved the issues that occurred immediately after scaling, we were able to scale from 60->100% over the course of a single day!
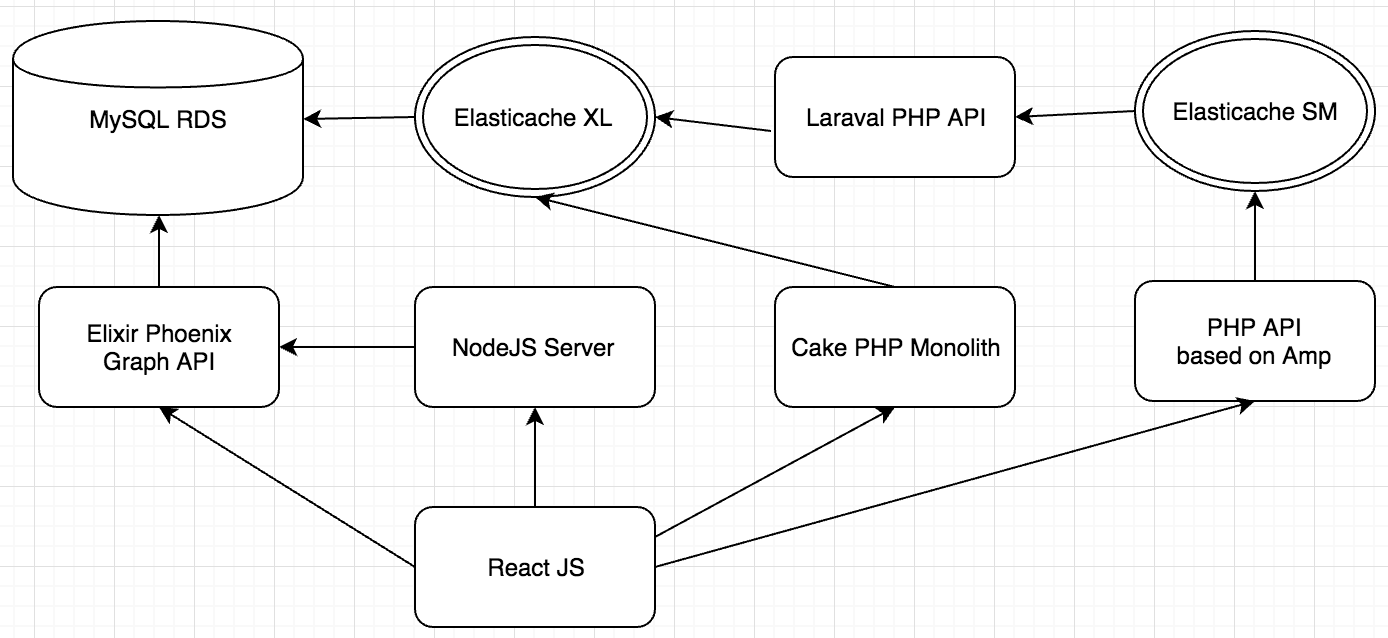
Product Page Architecture #
To help put the scaling challenges in the context of their broader technical architecture, here are the core services that drive our product page:
Routing Issues #
In our switch from nginx and CakePHP over to react-router, there were a few cases that started causing us trouble at 5% of traffic.
- Products that had been renamed
- URLs with more than one /
- URLs with special characters
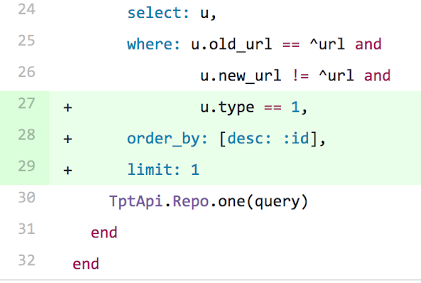
Products that had been renamed #
In our code base, when a product's title changes, its canonical URL "slug" is updated at the same time. We store these records in a database and had forgotten to incorporate logic that only retrieved the "latest" title. The fix was relatively straightforward, as detailed in this diff:
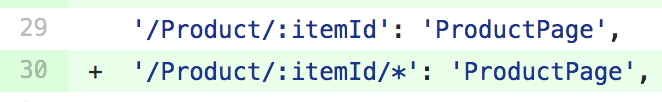
URLs with more than one / #
Using react router, it was relatively straightforward to handle malformed URLs. We simply added another route which would greedily capture another segment and disregard it, as in the following example:
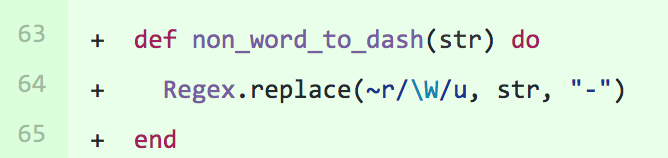
URLs with special characters #
We had a regex replacement that didn't account for unicode characters in our API. This simple diff solved the problem for us:
Periodic 504s from our Elixir Graph API #
Everything was smooth sailing until we had approximately 30% of traffic on the new page. We saw a very slow trickle of 504s being thrown by our Elixir Graph API - but nothing so far out of the ordinary that there was something actionable to do. Once we ramped up to 40%, we started seeing errors occur at a similarly sporadic rate but in much higher volumes. We ramped back to 10% to give ourselves some breathing room and started digging into our data. Here’s what we saw after the rollout:
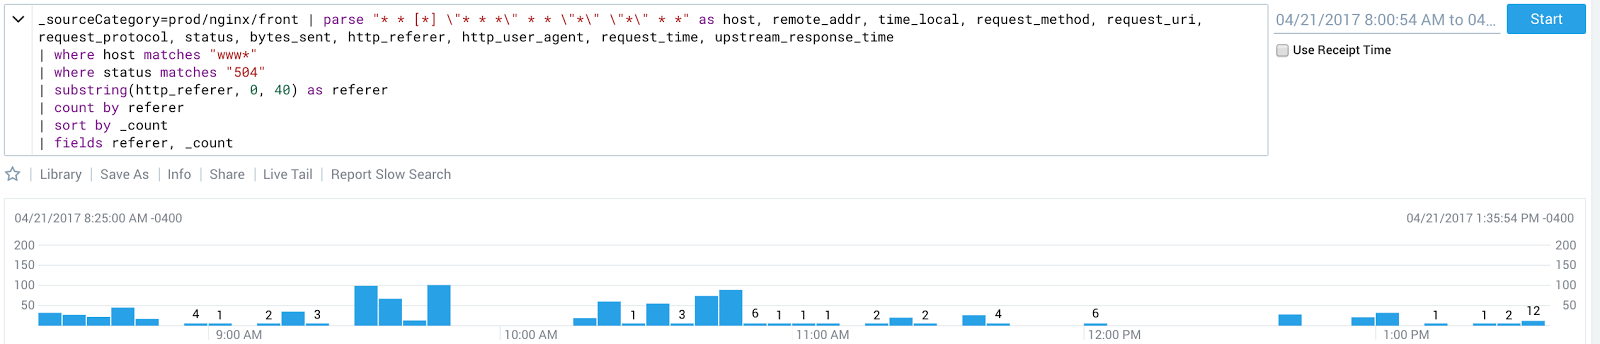 This Sumologic query shows the number of 504s flowing through our outermost load balancer
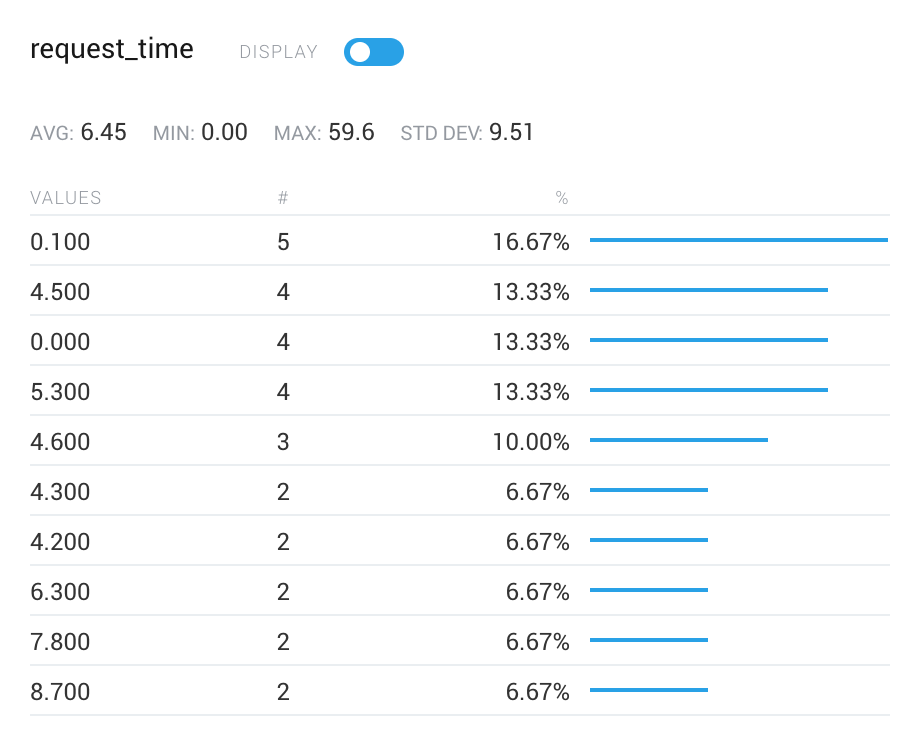
One of the most interesting pieces of data from this graph was that the request durations for those that returned 504s was extremely low - on the order of .1 seconds, far faster than the requested endpoint would ever realistically return.
Shanti, a key member of our API team, theorized that some connections were never being successfully established. This theory was corroborated by the fact there were no traces of failed requests in our API metrics. She narrowed down the issues to two key areas:
- The maximum number of connections allowed by Phoenix
- Connections never making it past the ELB
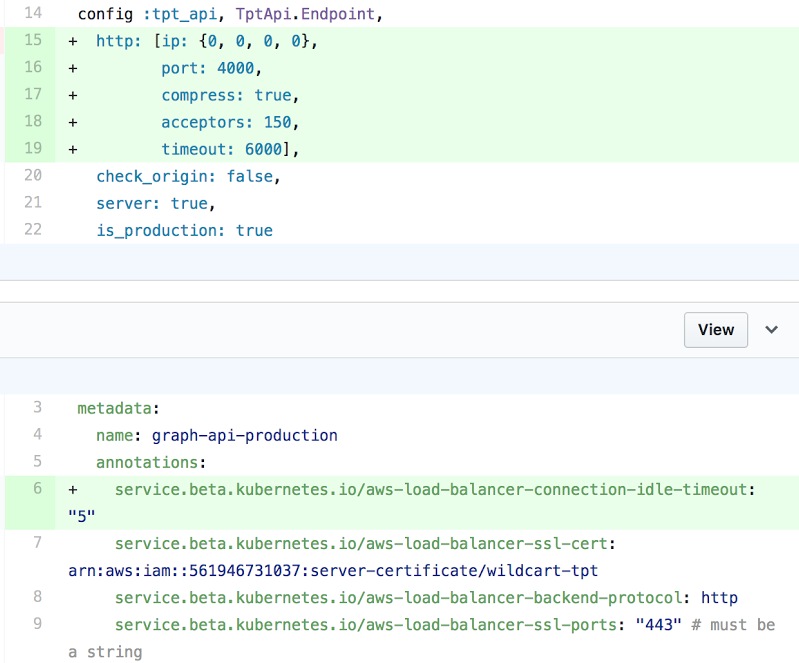
To fix the first problem, we simply updated the number of acceptors from the default value in Cowboy from 100 to 150.
To remediate the second issue we changed the ELB idle timeout. We configured the ELB to close a connection BEFORE the backend closes a connection. The result of this change is that a client would not connect to an ELB that had already closed it’s connection to the backend, as per Amazon’s docs related to HTTP 504s.
Resizable Image Server Overload #
Our Elixir Graph API exposes functionality that allows us to return dynamically sized images per request. The backing infrastructure to support this consists of CDN backed by a cluster of EC2 instances. As we ran our A/B test at 50% of traffic, we began to hear the fans of our EC2 instances whirring through this graph:
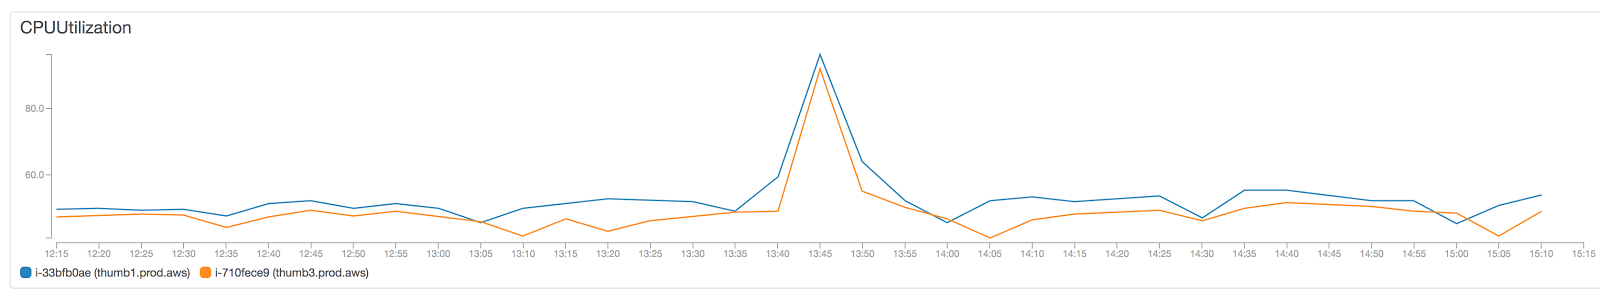
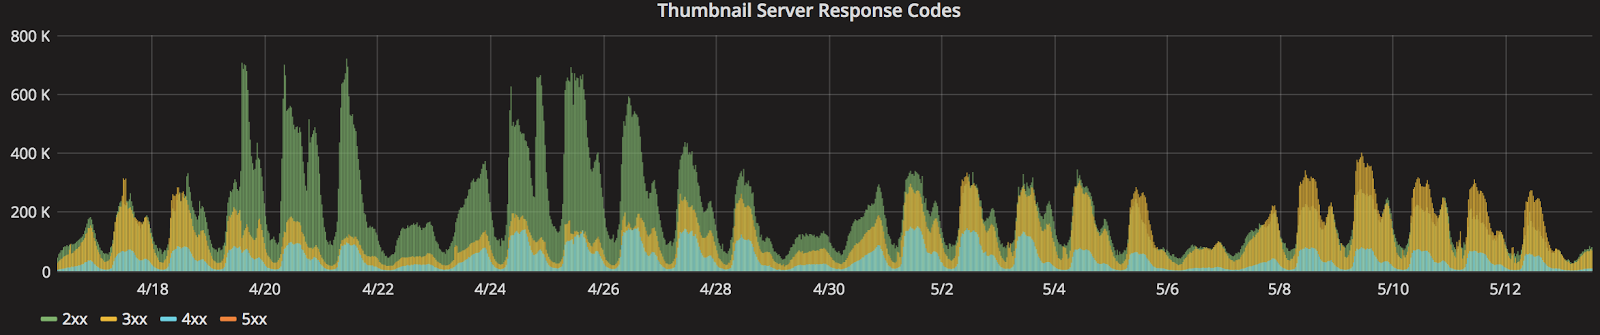
We realized that a number of pages were using slightly different sizes of the same underlying images due to a divergent code path in our API. Greg Thompson, the core developer of the product page team, helped consolidate code paths and cleaned up 700 lines of code in the process! Once we standardized on a size across multiple pages of our site (and added a couple of servers for good measure) we saw cache hits increase and load on the servers decrease. Here’s a graph that clearly shows an order of magnitude decrease in the total number of requests hitting the thumbnail server load balancer as well as the number of invalid requests (green and blue areas, respectively):
500s under load #
One evening after ramping to 60% and subsequently receiving an unusually high amount of traffic we saw a proportional amount of errors. We rolled back traffic and began to investigate. What we discovered was that the our Elixir Graph API AWS ELB had a surge queue during the time period of our errors.
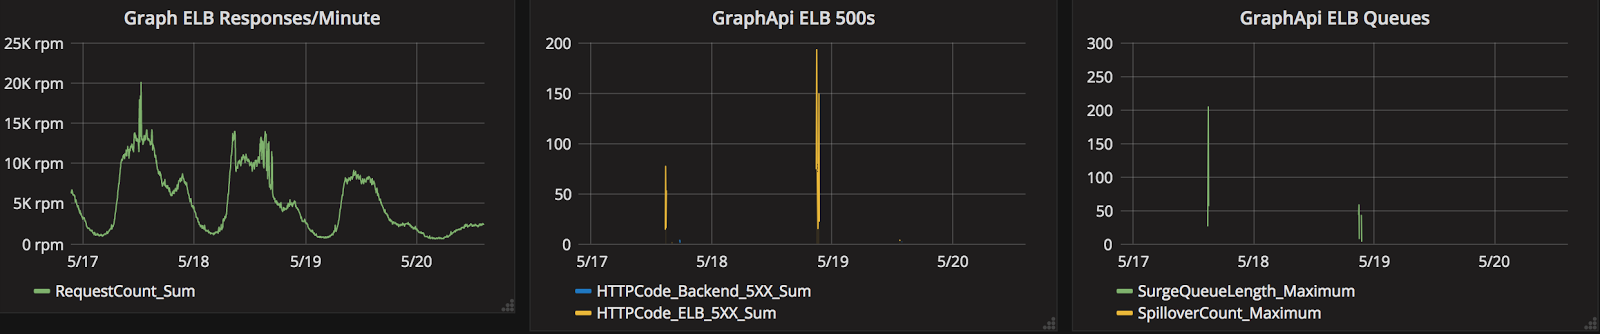
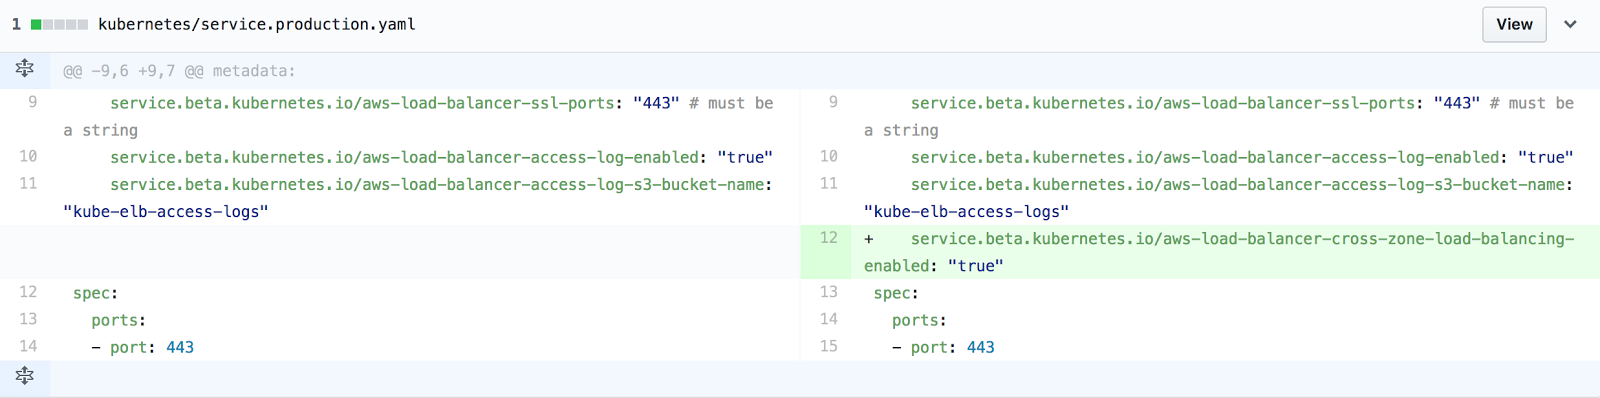
After digging more deeply into these issues, Lucas, our Infrastructure and Automation Technical Lead, discovered that by default the Kubernetes integration with AWS does not set up cross zone load balancing. A simple configuration fix was all it took to alleviate this issue.
Spikes of errors just after scaling #
We made it back to 60% after fixing our cross zone load balancing issue! Huzzah! Now let’s go to 65%.... Uh oh! For a few minutes after scaling, we saw some issues...but then everything cleared up.
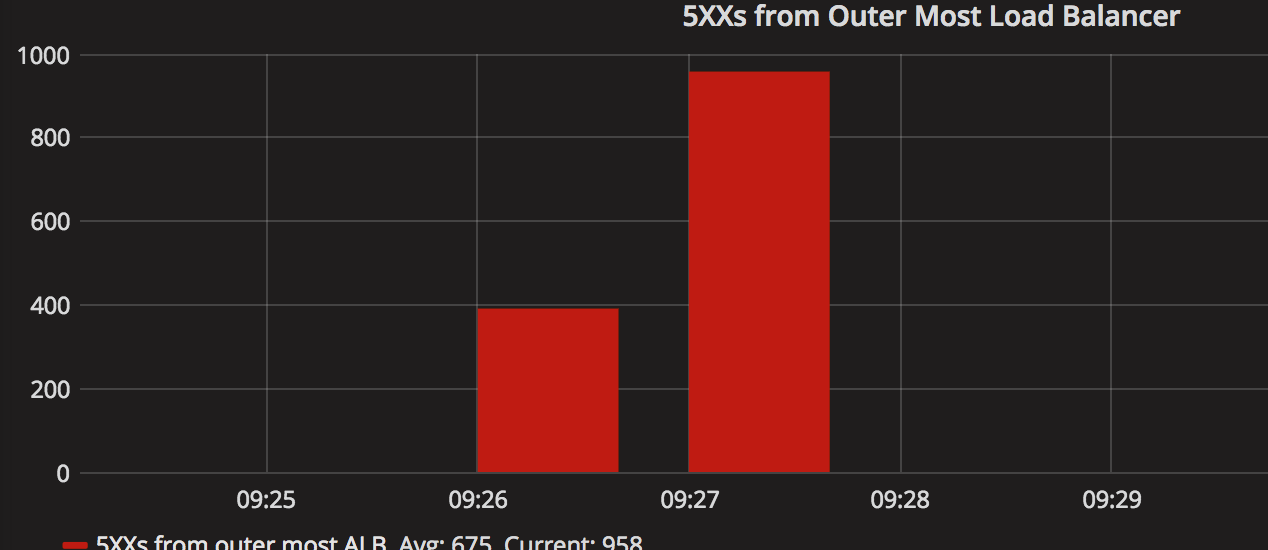
When we looked into our graphs, there were a ton of red herrings (number of open connections to Elasticache from the mobile API, number of DB threads locking, number of 500s from our outermost load balancer) but one stood out as very strange:
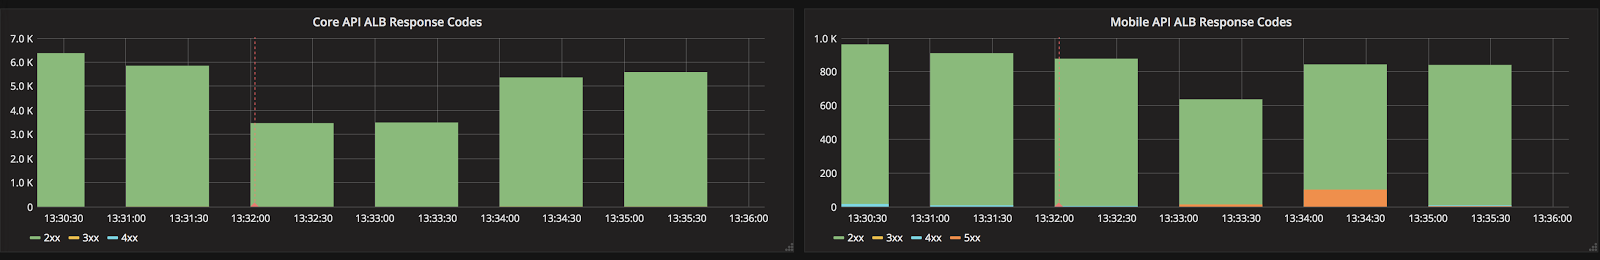
What this said to us was that our PHP API based on Amp was failing to establish a connection to our Laravel PHP API. This theory was confirmed by Bugsnag, which had a spike in reports of the following error:
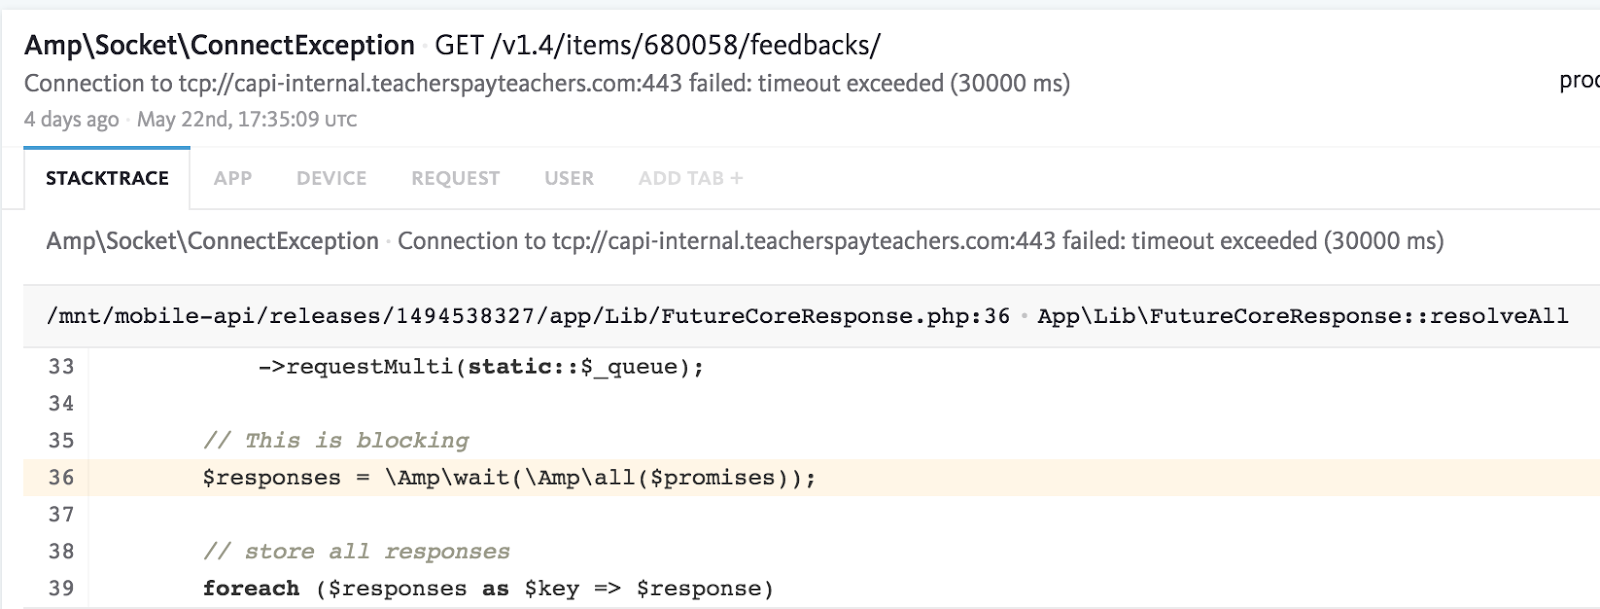
To provide a little more context, one of our PHP APIs uses an open source PHP library called Amp. We leverage Amp to make multiple concurrent connections to our Laravel PHP API and stitch together results from various endpoints in parallel.
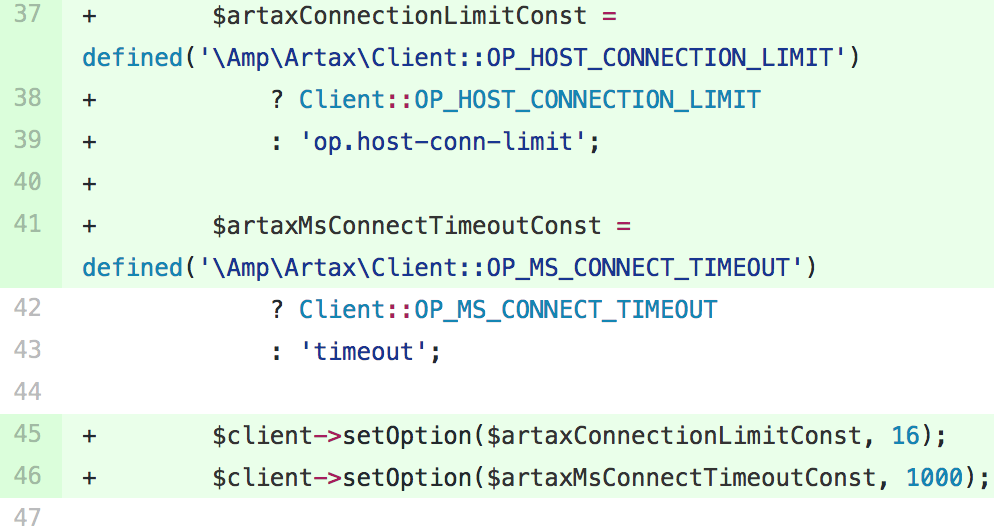
Our initial plan of attack was to modify some configurations in Amp that would allow us to more effectively use connections we’d already opened. Most notably, we modified the number of simultaneous connections available to us as well as the keepalive on those connections:
Unfortunately, we were still seeing issues with this configuration. We then decided to do use tcpdump on one of our Amp based API servers. tcpdump revealed to Peleg, a core member of our web platform team, that the API was making somewhere between 10-30 DNS requests per HTTP request! We discussed various solutions (using the OS DNS resolution, caching via memcache, updating the cache outside of the app, etc.) but eventually landed on a simple one line change that would allow us to reduce the number of DNS requests upstream by approximately 10x.
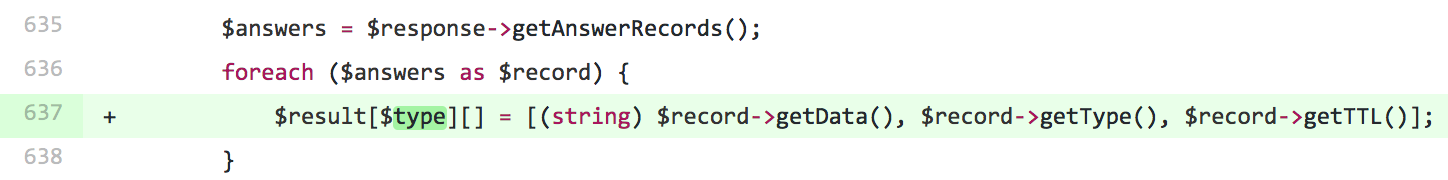
This change simply cached the requested record type, rather than the resolved response. Once we rolled this change out to our mobile api, we were able to scale from 60% to 100% over the course of a single day without any issues!
Wrapping Up #
Now that we've solidly landed on our new infrastructure, we've been able to really accelerate our product iteration velocity as well as our backend and front-end performance. We already have a number of experiments running on the new product page and are excited about improving our ability to help educators around the world as a result.
This was one of the most collaborative projects I've ever had the pleasure of working on. Every single engineer at Teachers Pay Teachers helped us accomplish this!
Do you have any interesting stories about technical hurdles you overcame while rolling out new functionality? Curious about more details of this rollout? Talk to us in the comments section!