A/B Testing Using React, GraphQL and Apollo
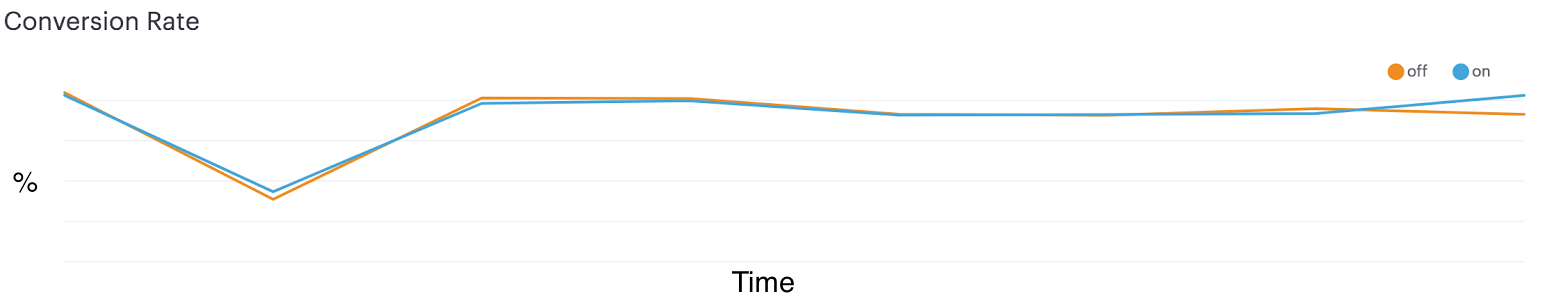
Here at Teachers Pay Teachers, we want to ensure that any change we make to our site benefits our community of educators. In order to do this effectively we take an extraordinarily data driven approach to releasing code. In addition to what you’d normally expect of a production ready feature (well tested, instrumented for performance, monitoring/alerting set up) we also rely heavily on Google Analytics to record not only actions taken on each page – but what “experiments” were active when those actions were taken. This lets us build dashboards of graphs that show us how our experiments are performing. Throughout this post I’ll share the details of our A/B testing implementation.
Now that you have some context about why you'd want to run an A/B test, let’s dive into our implementation!
From our Elixir Phoenix backend we expose a GraphQL API. There's a featureVariants query that has the following signature:
query FeatureVariants ($names: [String]) {
  featureVariants(names: $names) {
    name
    variant
  }
}
This endpoint is quite flexible as it allows us to request multiple flags simultaneously. It also allows for “variants” rather than “flags.” This means we can run A/B/C/D tests if we’d like.
We created a higher order component that allows any component to ask for feature flags from GraphQL via react-apollo. Here’s the code for it (slight modifications for simplicity):
This decorator will transform the response from an array of objects into a map and pass it along to the decorated component. For example, it'll turn this:
[
  { "name": "flag1", "variant": "on" },
  { "name": "flag2", "variant": "hover" },
  { "name": "flag3", "variant": "off" }
]
into this:
{ "flag1": "on", "flag2": "hover", "flag3": "off" }Here’s a trivial example of the decorator in action:
Using feature flags in this fashion worked extremely well until we started increasing the number of experiments running simultaneously. Each experiment caused us to make another HTTP request to our API. We decided to more fully leverage Apollo’s integration with Redux to cache responses from the API. This was as easy as batching feature variant requests per domain. We created a shared array that could be imported in multiple locations:
export const myFeatureFlags = ["flag1", "flag2", "flag3"];And here's an example of it in action:
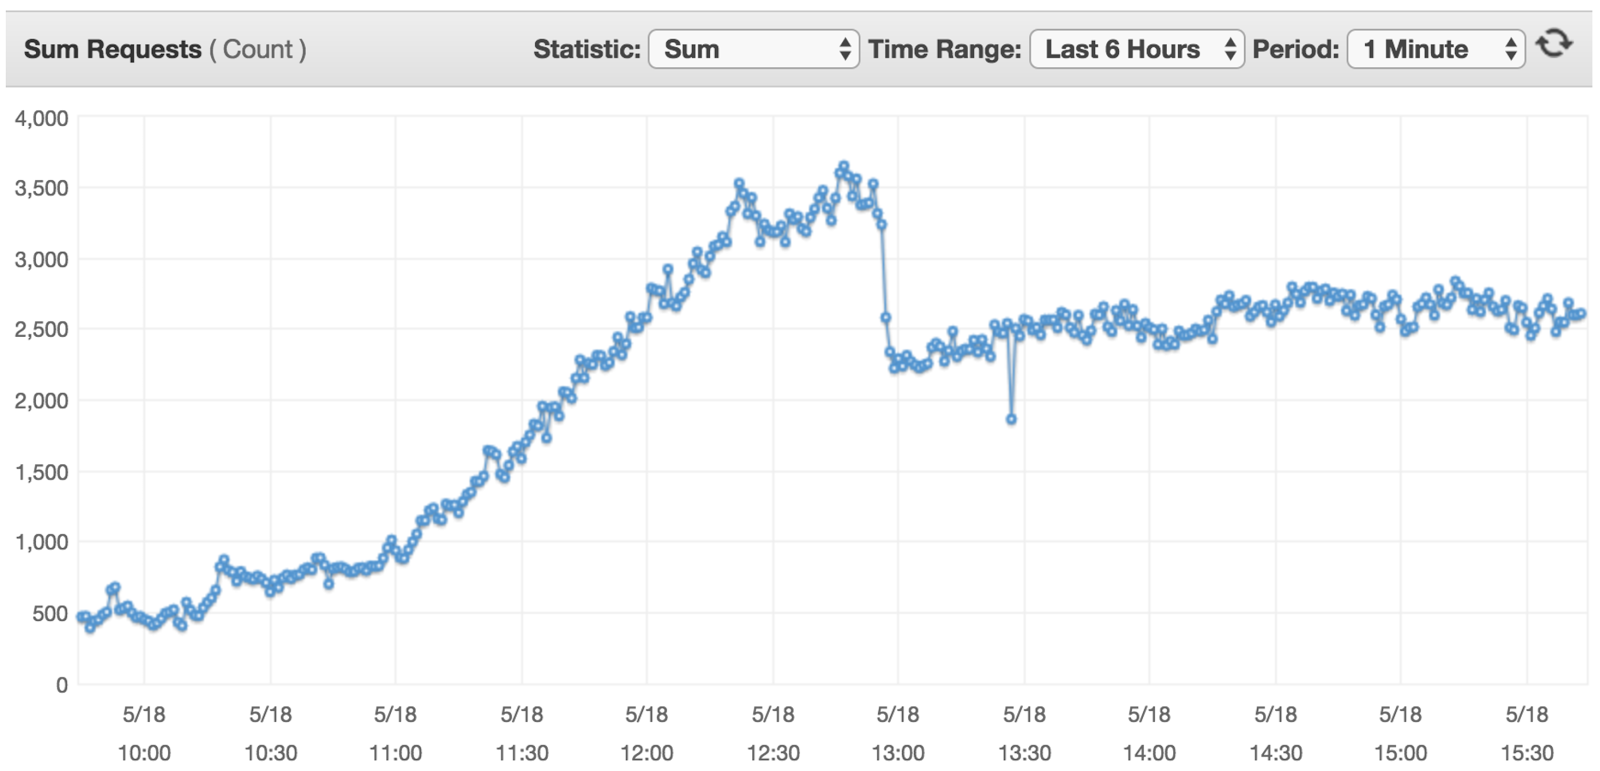
With that simple fix we saw a dramatic decrease in traffic to our graph API!
Finally, once we had all of that infrastructure set up and humming, it became extremely easy for us to include all experiments and their values in Google Tag Manager's Custom Dimension Data Layer. Here’s the code snippet that does it (layers of abstraction removed for readability):
And here’s an example line from a google analytics HTTP request from the network tab of a browser:
cd8: flag1,on,flag2,hover,flag3,off
Do you want to know more about our feature flagging system? Do you have questions about why we did something a certain way? Do you think there's a better way? Questions about how we use this data? Leave a comment below!