Debugging Distributed Trace Gaps with tcpdump
At Teachers Pay Teachers, our engineers rely heavily on DataDog APM’s distributed tracing feature to identify and analyze bottlenecks in application performance.
Earlier this year, we noticed strange gaps in about 0.5% of our applications’ distributed traces. These gaps lasted for up to several seconds, and caused user-facing service degradation and near-daily alerts for several weeks. We suspected that the cause of these gaps lay outside of application code, somewhere in the network, or else in the layers of software on top of which our applications run.
In the first part of this three-part series, we’ll show how we used tcpdump to test our initial theory that the gaps were caused by networking issues. To make sense of this theory, we’ll spend some time thinking about how HTTP requests are carried out on top of TCP conversations.
Spoiler: our networking theory turned out to be wrong. In the second part of this series, we’ll show how we used ftrace to spelunk into the Linux kernel to test our second theory — that the gaps were caused by host-level issues outside of our application.
In the final part, we’ll share how we’ve addressed these blind spots through monitoring improvements.
What is a distributed trace? #
Distributed traces are profiles of software tasks carried out by one of more applications connected over a network. These profiles include the sequence and duration of the function calls and network requests that make up the task. Distributed tracing systems like DataDog’s APM generate these profiles and provide helpful visualizations to make them easy to understand.
An example of a software task at TpT is when a customer clicks to learn more about a teaching resource on our marketplace. Their browser makes a request to our React server-side rendering layer, which makes a sub-request to our GraphQL data gateway, which makes a sub-sub-request to our resource metadata microservice, which makes a sub-sub-sub-request to Redis to get the data about the resource.
This task involves multiple applications, network hops, and function calls. Distributed tracing tools such as DataDog APM’s dd-trace-js are able to record details about tasks like these, and provide helpful visualizations to understand them.
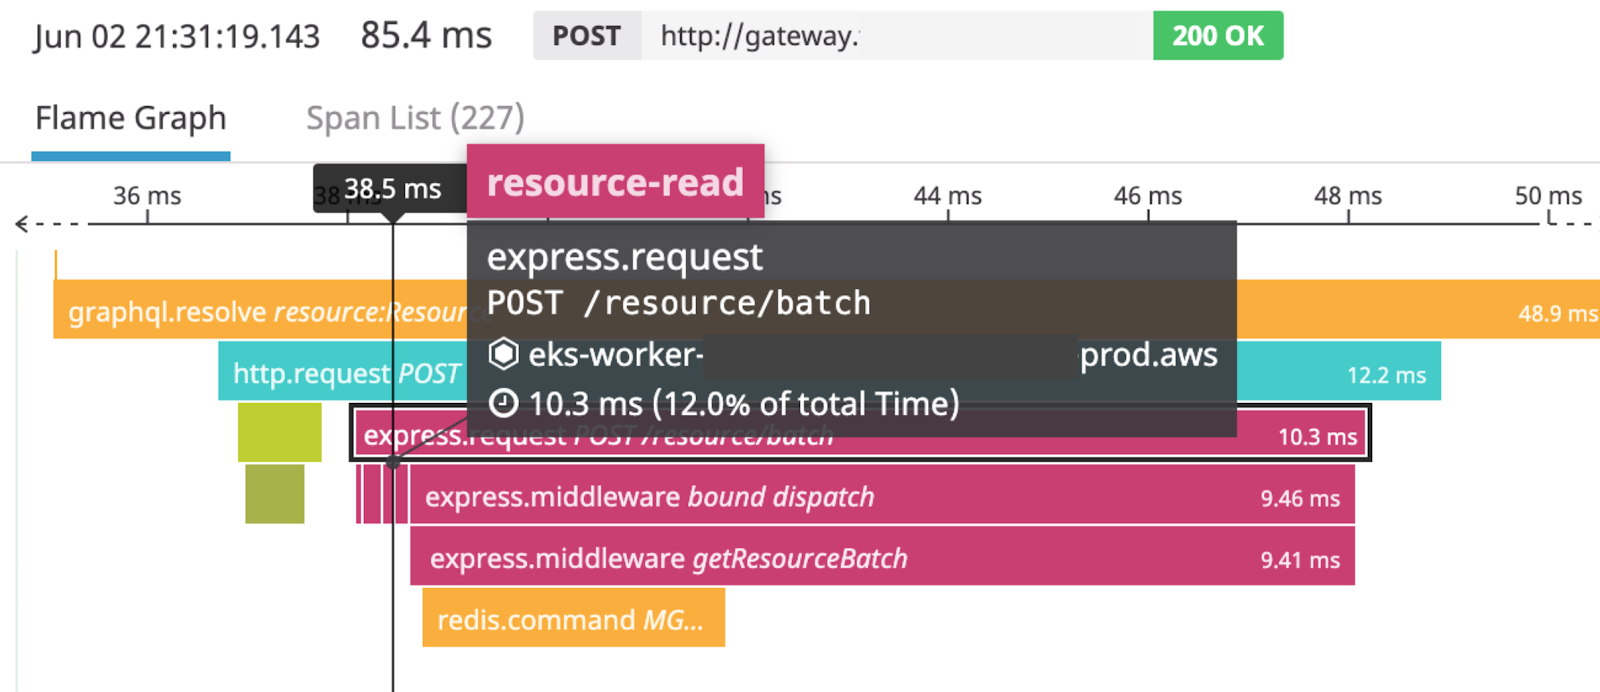
The image above shows a section of the distributed trace for this task. This section includes the HTTP request made by our GraphQL data gateway to our resource metadata microservice, as well as the request from our resource metadata microservice to Redis. By hovering over or clicking a span (one of the colorful blocks) in the DataDog APM UI, we can get more information about a function call or network request.
Dude, where’s my span? #
In the trace above, we can see that the spans, which represent different parts of the overall software task, are relatively compact. In other words, there aren’t large gaps between spans. Also, the duration of the trace is relatively short, and meets within our service latency objectives. A healthy trace!
So, our engineers were concerned when they noticed large gaps between the spans like in the trace below.
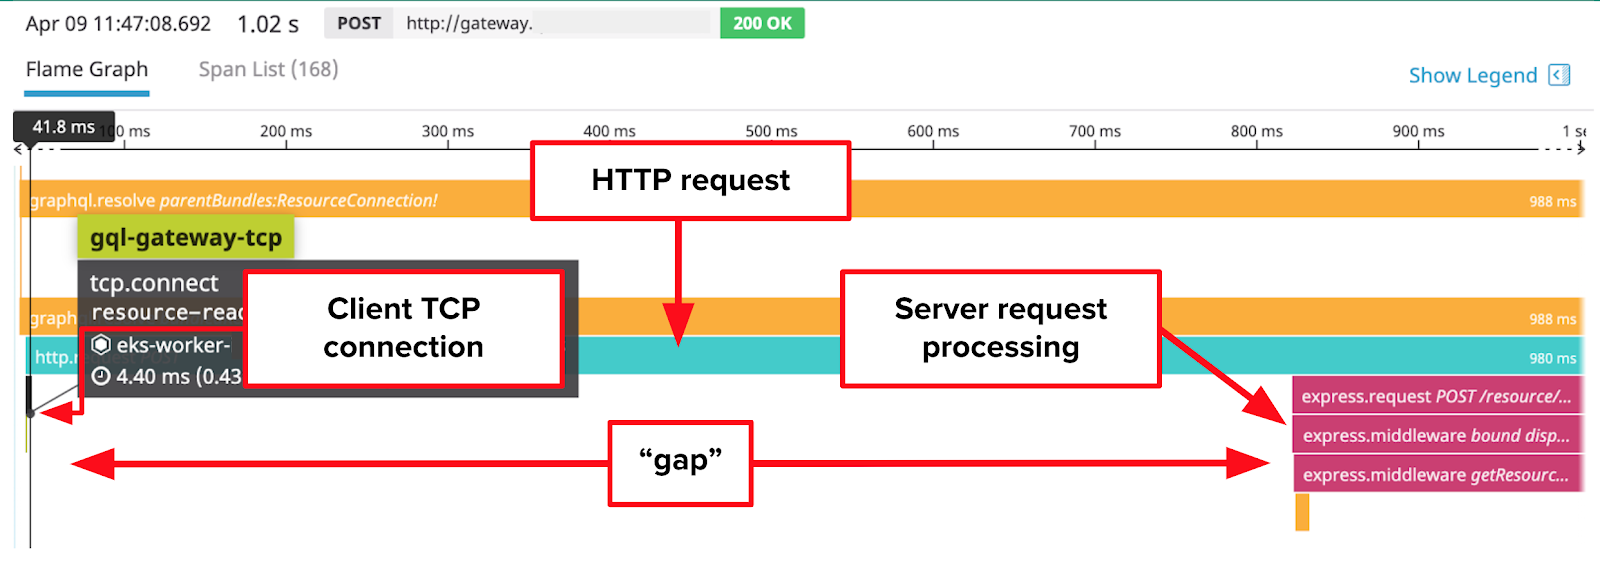
In this trace, the request contains a roughly 800 millisecond long gap, which causes the request to fail our service latency objectives by a long shot. DataDog helpfully shows us that the gap begins after our GraphQL data gateway creates a TCP connection to our resource metadata microservice, but before our resource metadata microservice starts processing the request.
Based on traces likes these, we made some preliminary judgements about causes of the gaps:
- Given the shortness of the tcp.connect spans (5ms in the example above), the gaps were not caused by delays in the establishment of TCP connections.
- Given that the express web framework begins processing the request after the gap has ended, the gaps were probably not caused by delays inside express.
Gaslit by metrics #
Our first instinct was to look at metrics in DataDog for anomalies and spikes that correlated with, and could help explain, these gaps.
We looked at application metrics like request rate, NodeJS runtime metrics like event loop delay, Docker metrics like CPU throttling, and system metrics such as load, IO stats, and CPU utilization.
Unfortunately, we didn’t find anything useful. The spikes that did correlate with the gaps, such as client-side request latency, were a result of the gaps, and so provided no explanation for them.
Unable to explain the gaps with DataDog APM’s traces or with metrics, we knew that we would have to dig deeper to make sense of them.
Making sense of the gaps #
But where to dig? The short answer: wherever our tracing tool cannot, or does not, trace.
Our tracing tool is DataDog APM’s dd-trace-js library, which generates traces of our applications’ activity. Once initialized inside a NodeJS application, it automatically “shims” NodeJS library functions such as http.request and net.Socket.connect, as well as for popular open-source NodeJS packages like the express web server framework. A shim (sometimes called a “monkey patch”) is a lightweight wrapper which adds to, subtracts from, or changes the behavior of the wrapped function.
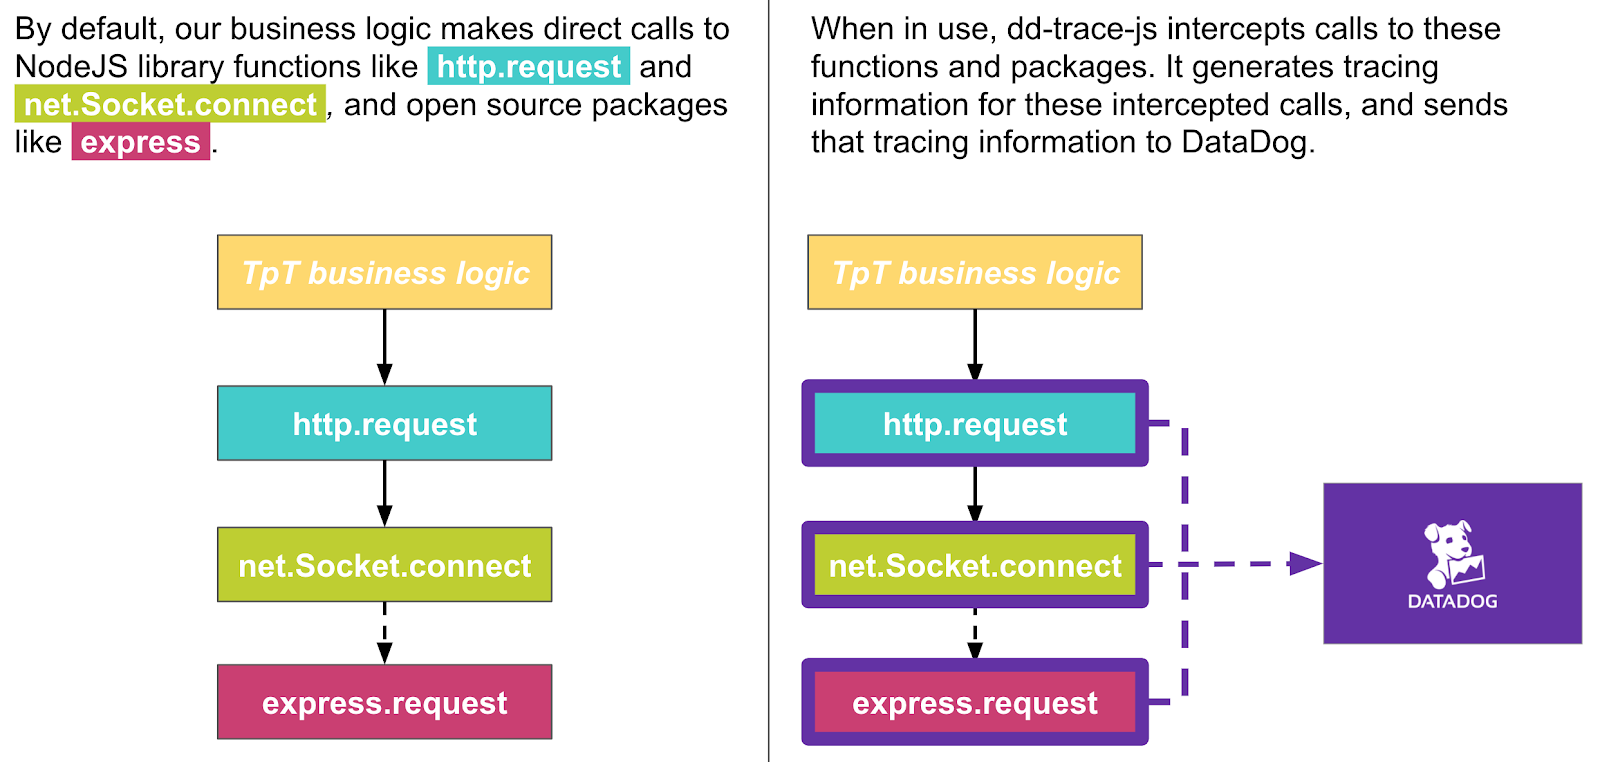
When our applications call these shims, dd-trace-js generates tracing information which it then sends to DataDog, and which DataDog uses to generate trace visualizations.
Although it generates tracing information for many NodeJS library functions and many open-source packages, dd-trace-js does have some “blind spots”, because it:
- Does not generate tracing information for every NodeJS function or open-source package.
- Cannot generate tracing information about any code that does not run inside the NodeJS runtime.
Delays in any blind spots between the tcp.connect and express spans would manifest as gaps in our traces. This line of thinking gave us a good foothold to start looking for possible causes of these gaps.
Maybe it’s the network? #
We first looked in a general way at the network as a possible cause. Although dd-trace-js does trace network calls, it does not have visibility into all network activity.
When one of our NodeJS applications makes an http.request, it sends data that traverses the network to the express web server framework running inside the remote NodeJS application. In our case, the network is owned and operated by AWS. As this data traverses the network, it passes through layers of software and hardware outside of the NodeJS runtime, and, therefore, beyond dd-trace-js’ ability to trace. A long delay in the network would show up in our traces as a gap.
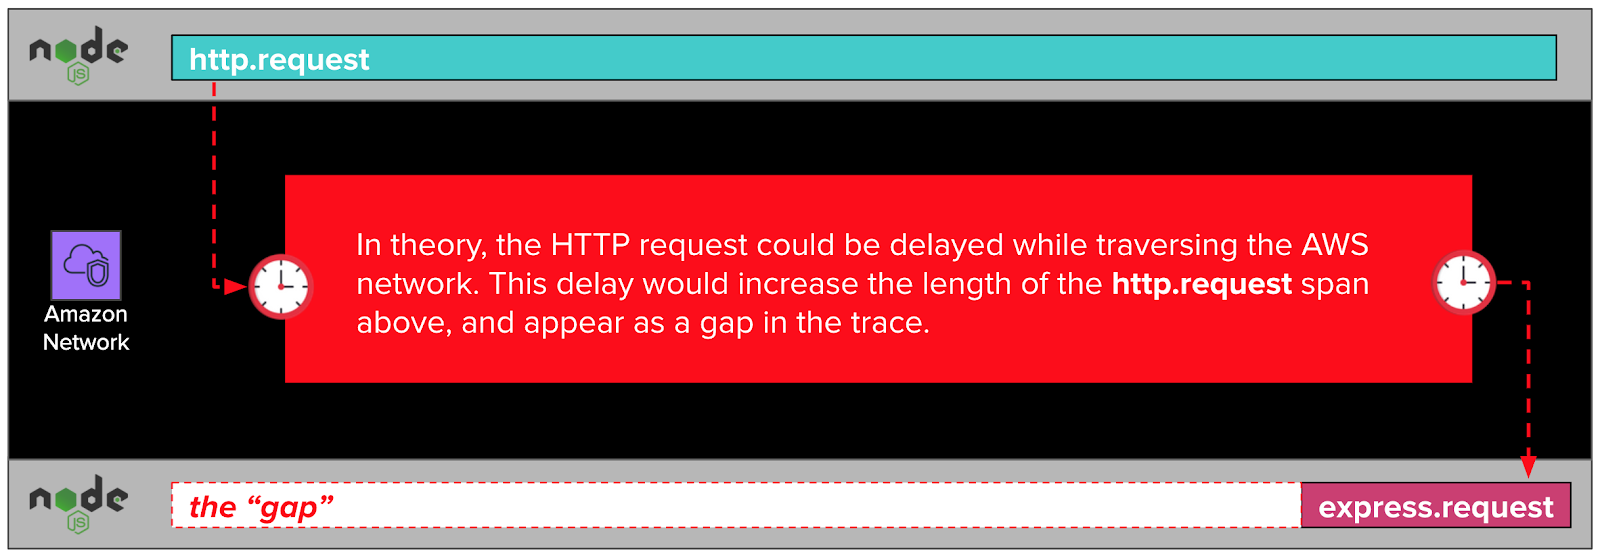
But wait! Didn’t we note earlier that the tcp.connect spans in our traces were narrow, and, therefore, fast? If establishing a TCP connection is fast, and TCP connections are made up of packets sent over the network, wouldn’t that rule out the network as a possible cause of the gaps?
While it’s true that the tcp.connect spans were fast, they represent only the establishment of a TCP connection, also known as the “TCP handshake”. The rest of the TCP conversation isn’t visible to dd-trace-js, and so isn’t captured in the trace. It’s possible, we thought, that part of the TCP conversation after the TCP handshake was being delayed long enough to cause gaps in our traces.
HTTP requests and TCP conversations #
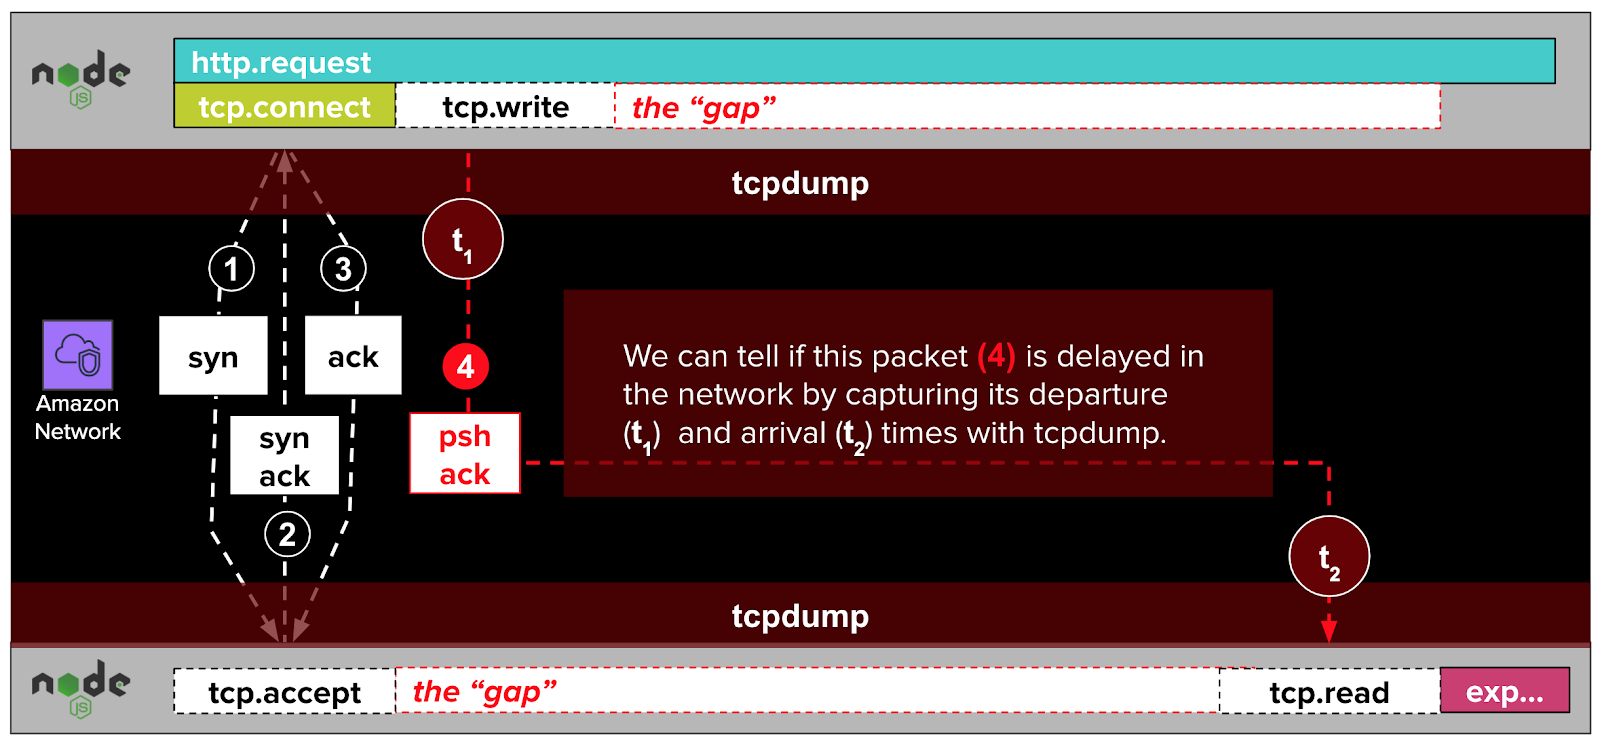
To clarify this line of thinking, it helps to have a high-level mental model of how an HTTP request from one NodeJS application (like our data gateway) to another (like our resource metadata microservice) is translated into packets within a TCP conversation.
Establishing the TCP connection #
When one of our NodeJS applications initiates an HTTP request to another, it calls the http.request function from the NodeJS library. Under the hood, that function uses the net.Socket.connect function from the NodeJS library to establish a TCP connection with the remote NodeJS application. We won’t get into the weeds about what TCP is, except to say that it’s a foundational protocol of the internet, on top of which other, higher-level protocols like HTTP and MySQL are built.
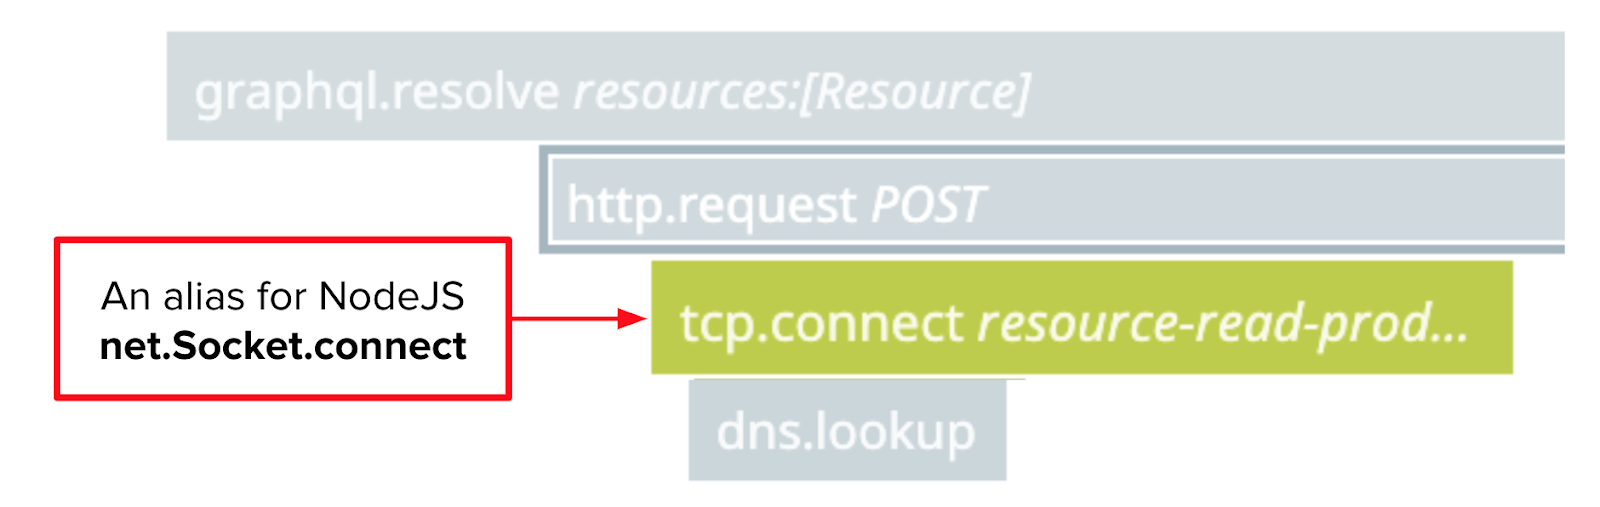
dd-trace-js traces calls to both http.request and net.Socket.connect. DataDog presents the latter as tcp.connect spans in trace visualizations.
The NodeJS net.Socket.connect function establishes a TCP connection with a sequence of three packets called a TCP handshake. We won’t get into the weeds here about what a packet is, or why it takes three of them to establish a TCP connection. We’ll just say that packets are messages sent over the network, and that the three handshake packets that establish a TCP connection do not include the HTTP request itself (e.g. POST /resource HTTP/1.1). Rather, this handshake opens the door for the HTTP request to come later. As we’ve noted a couple of times already, this part of the TCP conversation was always fast according to our DataDog trace visualizations.
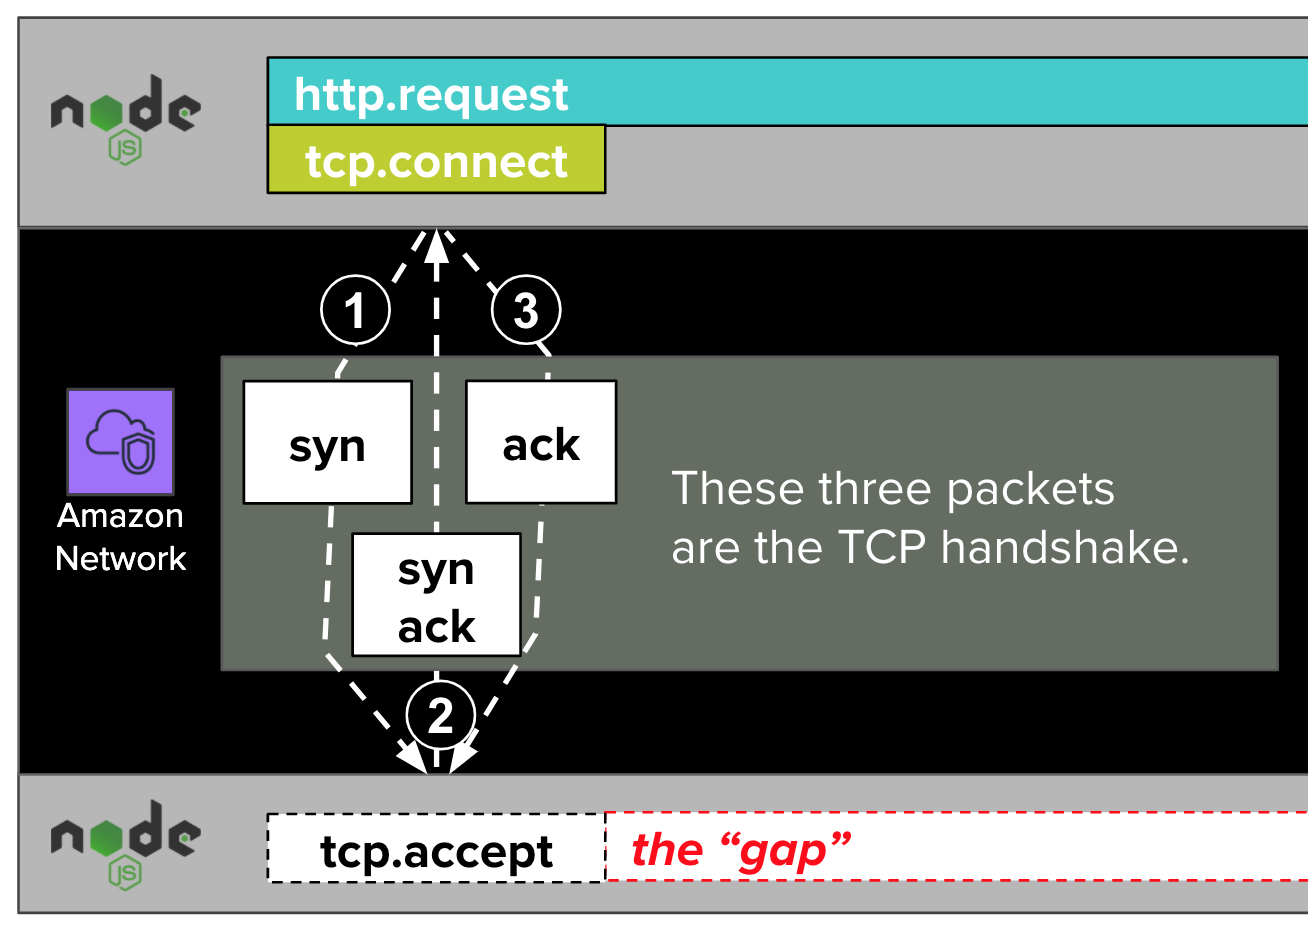
Once the handshake packets establish the TCP connection, the remote NodeJS runtime "accepts" the connection. We won’t get into the weeds about how this works. However, we’ll note that dd-trace-js does not trace the acceptance of connections. If it did, it might label this step as tcp.accept, as in the diagram above.
Delivering the HTTP request #
After the TCP connection has been established, the NodeJS application writes an HTTP request (e.g. POST /resource HTTP/1.1) to the established TCP connection with a call to net.Socket.write. This call results in an additional exchange of packets relayed over the AWS network.
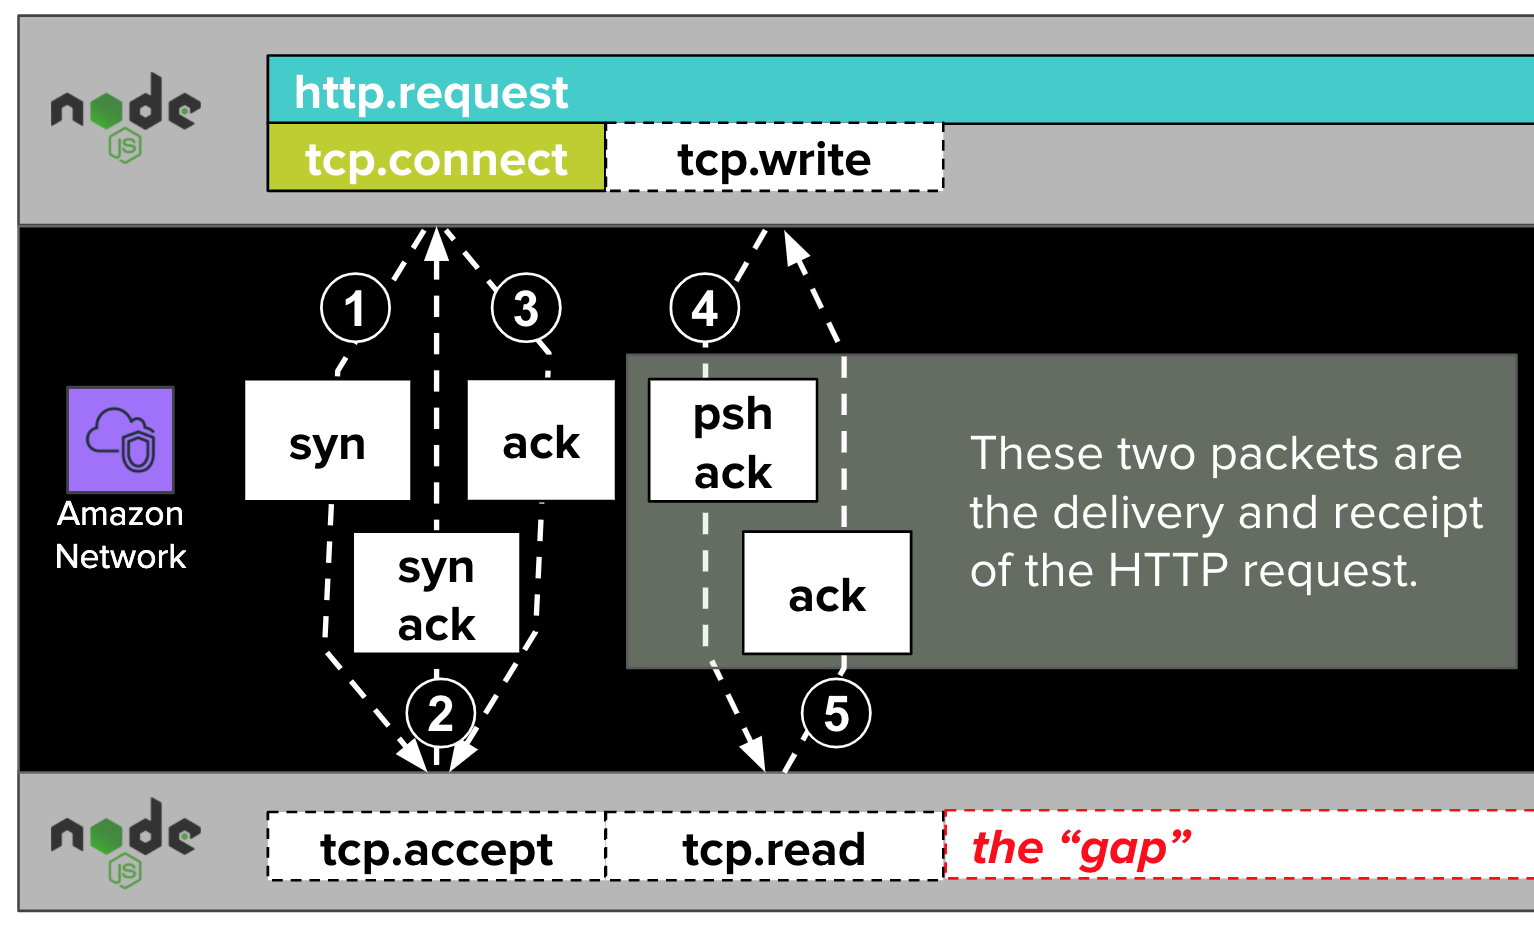
As with tcp.accept, dd-trace-js does not trace calls to net.Socket.write. If it did, they might show up in traces as tcp.write spans.
Once the packets resulting from tcp.write complete their journeys, the remote NodeJS runtime is able to read the written data. Visualized in the diagram above as tcp.read, this is another blind spot that dd-trace-js does not trace.
Theory: fast connect, slow write #
Now that we have a model of how HTTP requests are delivered inside of TCP conversations, and a better sense of some of dd-trace-js’ networking blind spots, we can formulate a theory about how delays in the network contribute to gaps in our traces.
According to this theory, the packets resulting from net.Socket.write (visualized as tcp.write in the diagram below) are delayed by some issue in the AWS network. These delays cause gaps in our traces. If we were to illustrate this theory, it might look something like this:
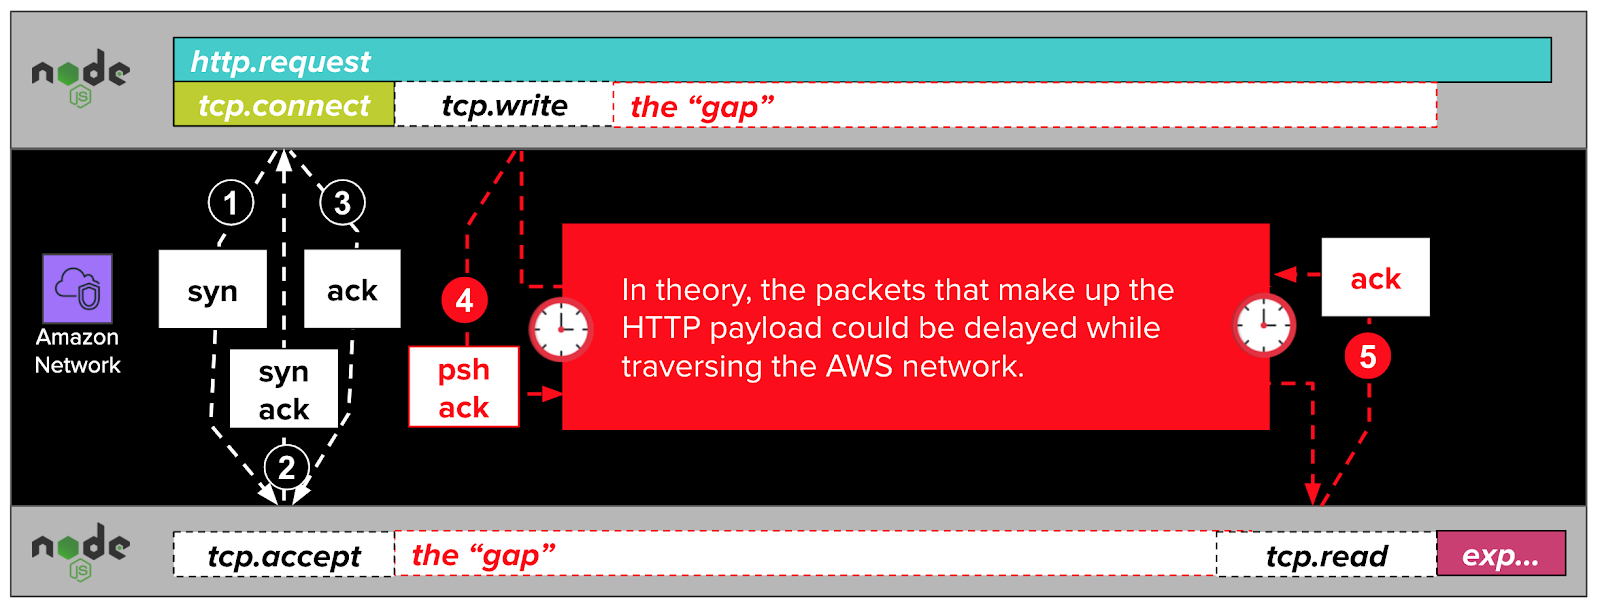
In the diagram above, the NodeJS application initiates an HTTP request with a call to http.request. Under the hood, this function calls net.Socket.connect (aliased as tcp.connect in DataDog trace visualizations). This call results in the establishment of a TCP connection with a three-packet TCP handshake. This handshake completes quickly, as indicated by the fast and narrow tcp.connect span.
After the TCP connection is established, the NodeJS application writes the HTTP request to the TCP connection with a call to net.Socket.write, visualized in the diagram above as tcp.write. Under the hood, this call generates a psh ack packet which travels over the network to the remote server.
According to our theory, the remote NodeJS application cannot read the HTTP request while its enclosing psh ack packet is delayed in flight through the AWS network. This imagined delay would, if real, manifest in our traces like the gap in the diagram above.
Eavesdropping with tcpdump #
We needed some way to test this theory. Unfortunately, DataDog didn’t have any information for us about any part of the TCP conversation after its establishment. Our network (owned and operated by AWS), wasn’t much help either — it is a black box which gives us little visibility into it.
Luckily, tcpdump can eavesdrop on packets as they enter and exit the network. By capturing the departure and arrival times of packets at either end of a TCP connection, we can determine whether delays in travel time are contributing to the gaps.
After we had set up tcpdump to eavesdrop on some of our client and server applications, we waited for trace gaps to occur. Once we had collected a handful of traces with gaps in them, we needed some way to pick out their packets from the millions that we had captured with tcpdump.
Matching trace gaps to packet captures #
We were able to do this by extracting some key information from traces with gaps in them. For example, in the trace below, we used the timestamp of the trace (Mar 30, 13:23:46.905) plus the offset of the tcp.connect span (250ms) to calculate when the TCP handshake was initiated (Mar 30 13:23:47.155). We also collected the local client IP address (redacted) and local client port (32900) of the TCP connection, which DataDog helpfully includes in each tcp.connect span.
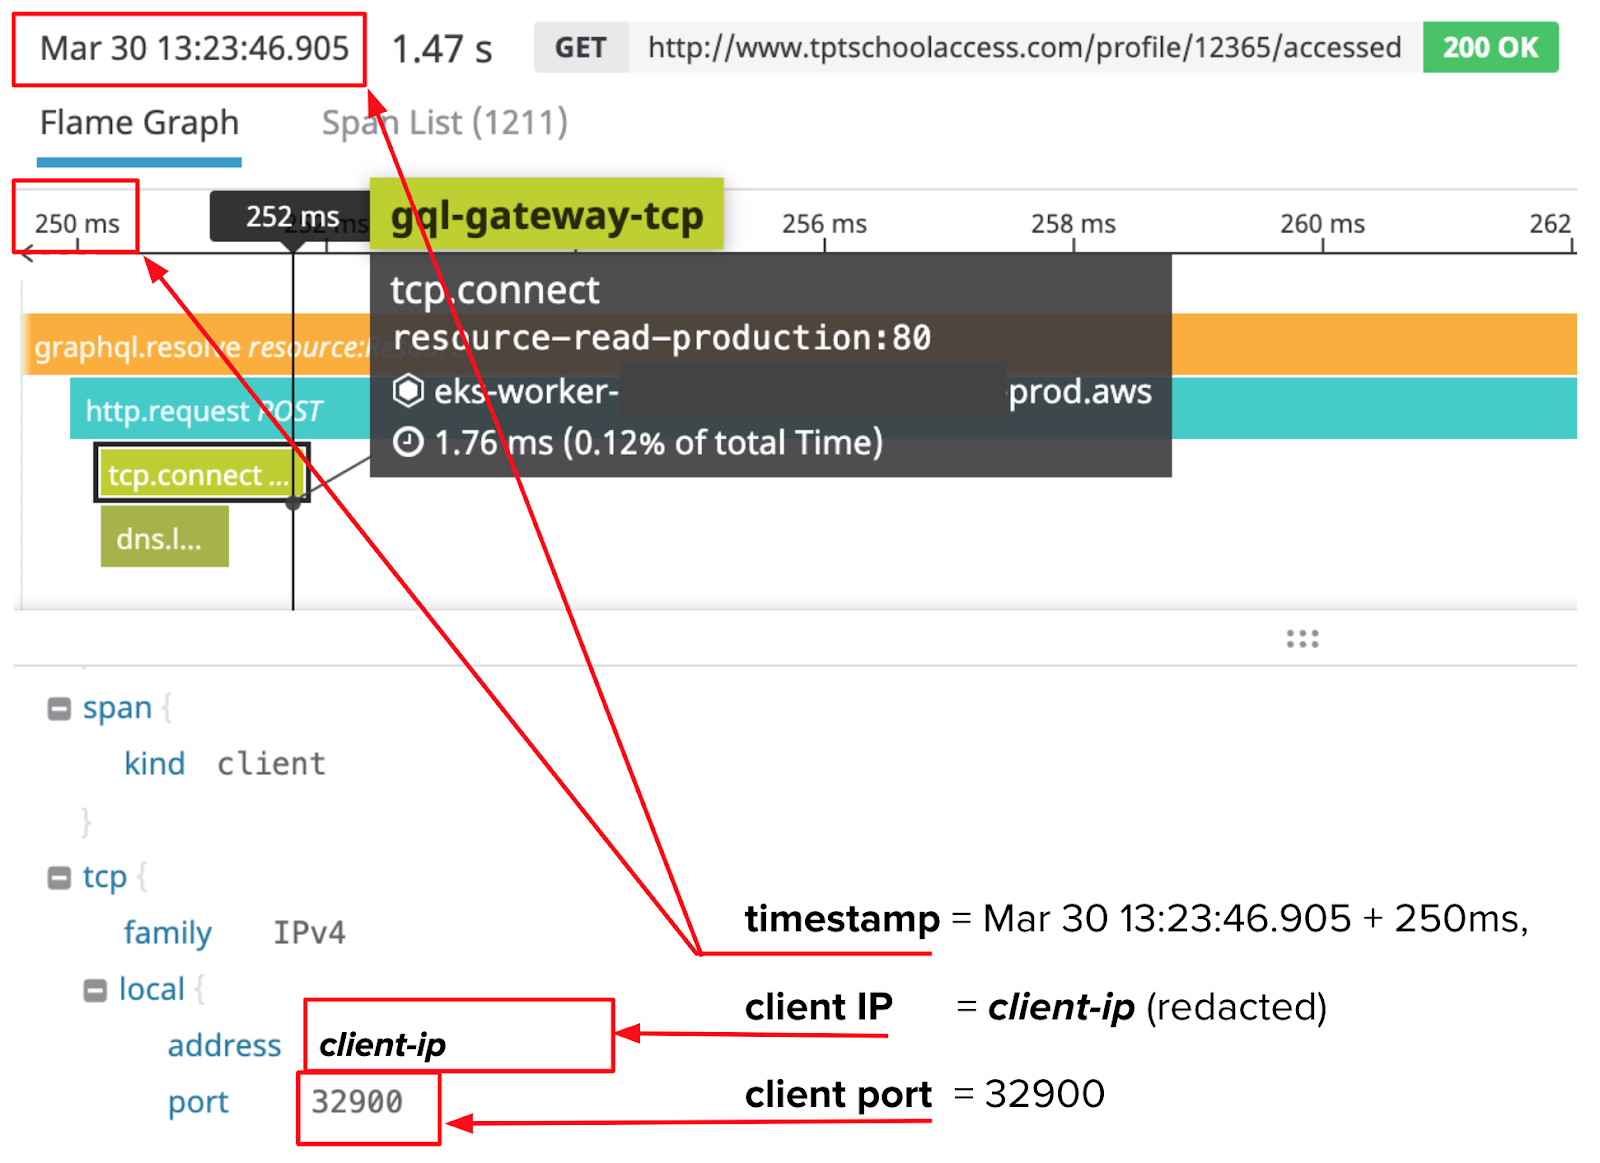
With these pieces of information, we searched through the millions of packets we had captured with tcpdump to find a single packet with a matching source IP address, source port, and (roughly the same) timestamp. Here it is:

This packet was the first in the TCP handshake represented by the tcp.connect span in the trace above. From this first packet, we were then able to find the remaining packets of the entire TCP conversation by searching for packets that were either:
- Sent from client-ip:32900 to server-ip:4001 within two seconds (the request duration, roughly) of the first packet
- Sent from server-ip:4001 to client-ip:32900 within two seconds of the first packet
Many of the packets from this conversation are shown below, all the way up to the HTTP response packet sent by the server back to the client.
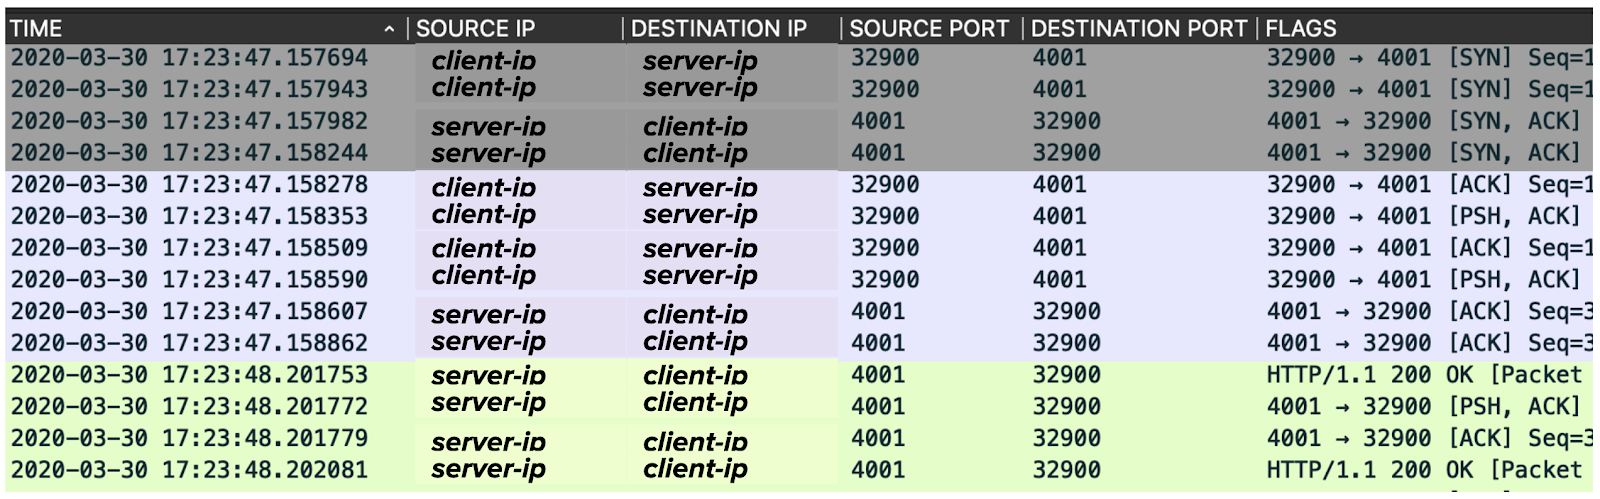
You may notice that some of them are duplicated, with minor differences in the timestamps. That’s because these packets are sniffed by tcpdump twice, once on the client-side, and once on the server-side. Calculating the difference in the timestamps of these duplicated packets gives us their travel time across the network!
Analyze the packets → it’s not the network #
To spare you from doing math with the dense information in the packet capture above, we’ve extracted and re-arranged the important parts into the table below.
| Phase | TCP flags | Source | Sent at (s) | Destination | Received at (s) | Delay (μs) |
|---|---|---|---|---|---|---|
| TCP handshake | SYN | Client | 47.157694 | Server | 47.157943 | 249 |
| SYN ACK | Server | 47.157982 | Client | 47.158244 | 262 | |
| ACK | Client | 47.158278 | Server | 47.158509 | 231 | |
| HTTP request | PSH ACK | Client | 47.158353 | Server | 47.158590 | 237 |
| ACK | Server | 47.158607 | Client | 47.158862 | 255 | |
| HTTP response | ACK | Server | 48.201753 | Client | 48.202081 | 328 |
Looking at the times it takes for each packet to travel between the client and server (the Delay column), it’s evident that the gaps are not the result of networking issues: the travel time of each packet takes less than 330 microseconds.
However, we do see evidence of a delay between the two packets highlighted in pink. After the server sends a packet acknowledging that it has received the HTTP request, and before it sends the packet containing the HTTP response, there is a 1.043244 second delay. This delay occurs within the gap of the trace above, and is the largest individual contributor to the overall trace duration.
At this point in the investigation, we were now somewhat confident that:
- The gaps are not the result of delays in packet travel time.
- The gaps are happening somewhere on the server-side.
What’s next? #
Testing our theory that the gaps were caused by network delays proved it to be incorrect. However, our efforts were not wasted. By eliminating one theory, we moved that much closer to finding the root cause. As a plus, the data we collected with tcpdump revealed the gap to be occurring on the server, sometime after acknowledging the HTTP request, but before sending the response.
Having eliminated this first theory, we could turn our attention to some of the other blind spots we identified above. In the next partin this series, we’ll talk about how we used ftrace to shine a light into these spots.